You are here
Horizontal Inequalities in Education: Profiles of 16 Countries
In conjunction with a recent study on the relationship between horizontal education inequality and violent conflict conducted for UNICEF, FHI 360’s Education Policy and Data Center (EPDC) produced 16 Education Inequality Profiles for countries in which FHI 360 has ongoing education projects and for which data on education inequalities could be compiled. The profiles portray data for 15-24 year olds by ethnic, religious, and subnational composition for the following indicators: Group Gini (GGini) Index, educational attainment, and mean years of schooling. By illuminating education inequalities within countries, the profiles serve the purpose of explaining the context in which education policies in these countries are implemented and informing the design of education strategies and interventions.
All of the countries profiled are sub-Saharan African countries, with the exception of Afghanistan. The information used in the creation of the profiles comes from individual-level records of educational attainment, demographic information, and household assets, included in three primary datasets:
· The Integrated Public Use Microdata Series International (IPUMS International)
· Demographic Household Surveys (DHS), and
· Multiple Indicator Cluster Survey (MICS)
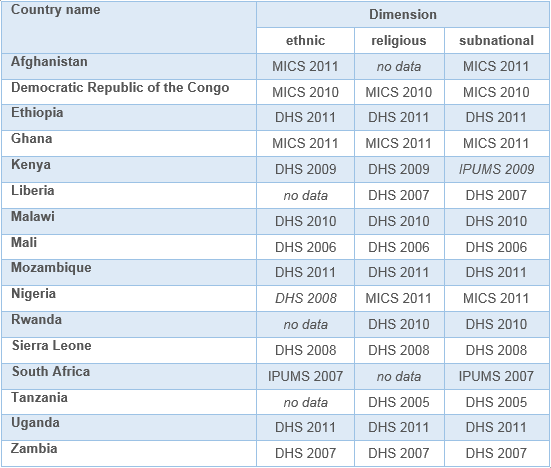
Specific data sources used for each country are listed in Table 1. In most cases, the same dataset was used to build all sections of the profiles, but a few exceptions, as well as cases of missing sections where ethnicity, religion, or subnational division indicators were not available, are noted in the table.
Table 1. Sources of data in the Education Inequality Profiles
Overview of horizontal inequalities
The Education Inequality Profiles display education data by ethnic, religious, and subnational composition and corresponding GGini coeffcients for each section. The sections focusing on ethnicity and religion also display the country's ethnic and religious breakdown, revealing minority and majority groups. Ethnic and religious groups comprising 5% or less of the population were identified in the original data and are combined into a single category called "other ethnicity" or "other religion," which could be quite sizeable in countries where many small ethnic or religious groups exist.
Figure 1 provides an overview of GGini coefficients for all countries. The GGini Index is based on the size of the differences between group averages within a given country, year, and type of inequality (i.e., ethnic, religious, and subnational) and the group’s relative size as a proportion of the country’s population. The GGini, which is calculated based on the mean years of schooling, can be interpreted as a measure of how concentrated the total stock of education is in any one ethnic or religious group. A GGini of 0 would mean that all groups or regions have the same mean years of schooling, while a GGini of 1 can be understood loosely to correspond to a situation where one group or region has essentially exclusive access to all the education in the country, to the detriment of all other ethnic groups.
Figure 1. Educational inequalities among groups
.jpg)
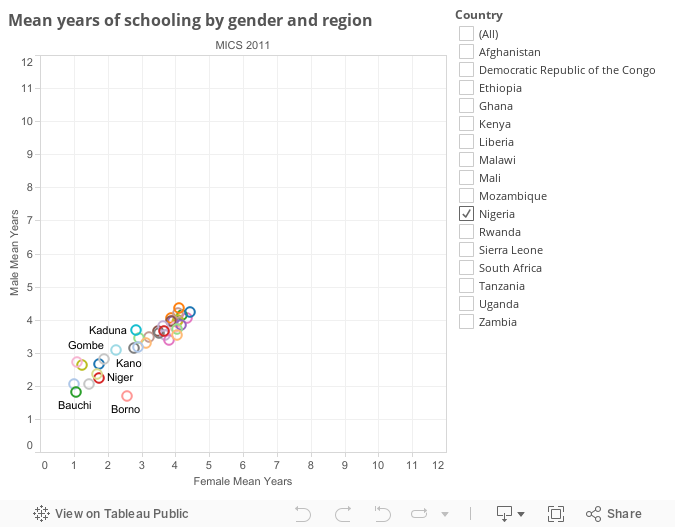
From Figure 1, it is clear that, overall, the highest GGini coefficients are found in the subnational cross-section, with the highest GGini (0.45) observed in Nigeria. This can be explained by the fact that 16 of Nigeria’s 37 provinces, primarily in the Southern and Central parts of the country, perform similarly, with the majority of 15-24 year olds having completed at least primary schooling; however, in Nigeria’s remaining 21 provinces, performance is widely dispersed, with most of the lowest attainment rates found in the Northern parts of the country (select "Nigeria" on the country menu to the right of the graph for Figure 2). The GGini for Kenya’s subnational groups is also relatively high at 0.29. This is most likely explained by the Northeastern region’s far lower educational attainment than the rest of the country’s, with 73% of 15-24 year olds having not completed primary schooling.
Malawi, Rwanda, and Mali have the lowest GGinis for subnational region, at 0.02, 0.06, and 0.07, respectively. In Rwanda and Mali, the capital cities of Kigali and Bamako have noticeably higher educational attainment than in the rest of the country; however, areas outside of the capital exhibit very similar performance. You can select the country you would like to view on the country menu to the right of the graph for Figure 2 to explore these trends further.
Figure 2. Highest subnational GGini is observed in Nigeria: mean years of schooling by gender and region
For the ethnic and religious categories, GGini coefficients are, overall, not as high, but they are slightly higher among ethnic groups than religious groups. However, despite relatively low ethnic and religious GGinis, there are a number of cases in which one or two groups noticeably outperform others in terms of educational attainment. One example is Kenya, which has an ethnic GGini of 0.10. In 2009, Kikuyu 15-24 year olds had around 9.5 mean years of schooling, as compared with 5.79 mean years of schooling among Somali 15-24 year-old males and 3.01 mean years of schooling among Somali 15-24 year-old females.
However, in other countries, ethnic and religious groups’ educational attainment and mean years of schooling cluster closely together. In Mali, the religious GGini is virtually zero, at 0.001. Another example of a country with a low GGini is Zambia; the religious GGini is 0.01, while the ethnic GGini is 0.03.
Highlights and Trends
The inequality profiles reveal several noteworthy trends. The scope of gender discrepancies varies across countries, with males exhibiting higher mean years of schooling than females in most cases. In Afghanistan, across all groups, female mean years of schooling are lower than the corresponding male mean years of schooling. Large discrepancies are especially visible regionally, in the Southeast and East. In Nigeria, as well, both the Hausa and Fulani ethnic groups demonstrate substantial gender discrepancies by mean years of schooling. In Uganda, however, among more than half of the ethnic groups and the Muslim religious group, females slightly outperform males in terms of mean years of schooling. In the rest of the groups, mean years are nearly the same, except for among the Ngakaramajong.
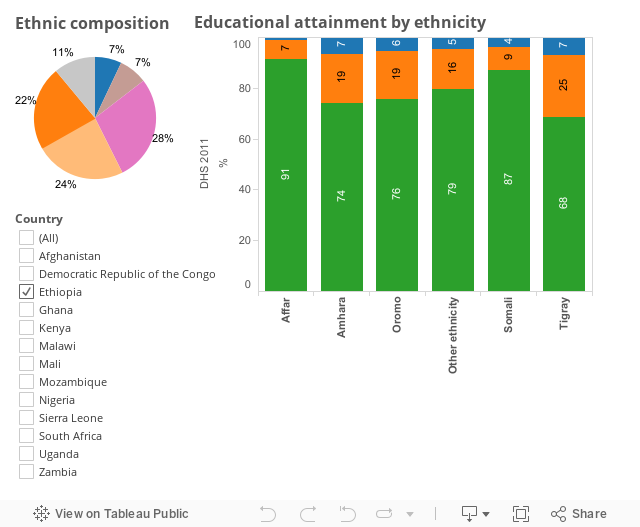
More often, it is a minority ethnic group which has the highest educational attainment. In 7 of the 16 countries, an ethnic group comprising less than 12% of the country’s 15-24 year olds has the highest educational attainment, whereas in 5 of the 16 countries, the largest or second-largest group has the highest educational attainment. For example, by selecting "Ethiopia" on the country menu for Figure 3, it is apparent that Ethiopia’s Tigray group, although comprising a relatively small percentage of 15-24 year olds at 11%, exhibits the highest attainment rate, with 32% of 15-24 year olds having completed at least primary school in 2011.
Figure 3. More often, a minority group has the highest attainment: educational attainment by ethnicity
There is no obvious trend in minority versus majority groups’ educational attainment among religious groups; however, several interesting examples stand out. Sierra Leone’s Muslim group, although the majority of 15-24 year olds at 75%, exhibits the country’s lowest educational attainment rate, with 42% having completed at least primary schooling in 2008 in comparison with 60% among the Christian group. In Liberia, on the other hand, the country’s largest religious group by far, the Christian group, has the highest rates of educational attainment, with 43% of 15-24 year olds having completed at least primary schooling in 2007.
It is also apparent, in many cases, that educational attainment and mean years of schooling are the highest in urban areas. In the Democratic Republic of Congo’s (DRC) capital city of Kinshasa, where 91% of 15-24 year olds have completed at least primary schooling, educational attainment is considerably higher than in the DRC’s other regions. Other examples include Ethiopia, where educational attainment is the highest in the cities of Addis Ababa and Dire Dawa, with 22% of 15-24 year olds having completed secondary schooling as compared with 4%-9% elsewhere. In Ghana, the Greater Accra area is the region with the highest educational attainment, with 19% secondary school completion, while all other regions exhibit 7% or lower secondary school completion rates.
To further explore EPDC’s Education Inequality Profiles, visit: http://epdc.org/tags/education-inequality-profiles.
Additionally, you can access the underlying dataset, with mean years of schooling broken down by ethnic and religious groups, here. See our database to download data on subnational mean years of schooling.
Add new comment