You are here
Learning outcomes indicator changes
EPDC Learning outcomes indicator changes
In the run-up to 2015, there has been discussion of new education indicators used to measure progress on learning goals, and there is intense interest in developing indicators that capture students’ learning. The Brookings/UIS Learning Metrics Task Force is one initiative that has focused its efforts in this regard. The EPDC is currently engaged in an overhaul of its learning outcomes indicators, aiming to simplify the indicators presented in our database and make our learning outcomes data easier to search. One change concerns data from the “citizens-led” ASER, UWEZO, and Beekungo assessments. The indicators for these data were previously presented in the EPDC database according to the levels used in their reports (e.g. % who can read nothing, % who can do grade 2 subtraction, % who can read connected text). Instead of referencing levels by name, our new indicators use the lowest and highest levels tested on the exam to establish more general indicators that allow EPDC to use the same set of indicators with the ASER, UWEZO, and Beekungo assessments as for larger, internationally comparable assessments. These new indicators, which are similar to ones used by the World Bank’s EdStats website, are:
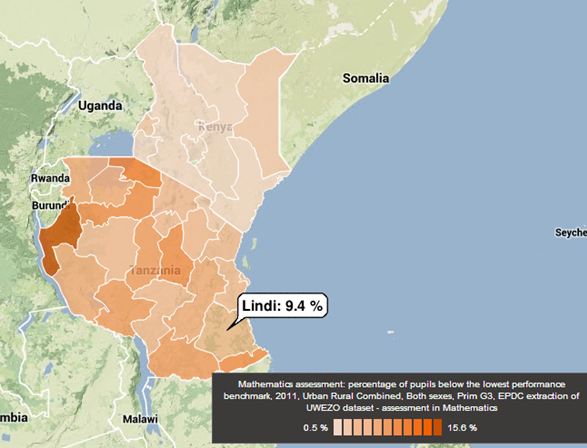
· Percentage of pupils below the lowest performance benchmark
· Percentage of pupils at or above the lowest performance benchmark
· Percentage of pupils at the highest performance benchmark
The three new indicators can be applied to both reading and mathematics assessments, and vastly simplify the number of learning outcomes indicators that come from these sources. However, it is important to note that, although the learning outcomes indicators we use will now be the same across all international and national assessments, the data are not necessarily comparable across countries, assessments, or languages and the difficulty and content of assessments varies. The performance benchmarks are specific to each assessment, and each indicator should be interpreted in relation to the assessment in question only (for example, the “percentage of pupils at the highest performance benchmark” on the PIRLS assessment).
An important resource to consult when using EPDC learning outcomes data is our collection of landing pages, which include a general About EPDC Learning Outcomes page and landing pages devoted to the different assessments that outline what an assessment tests and note whether the assessment is comparable over time and across countries. These pages will be updated in the coming weeks with the performance levels covered by each test and will document which levels correspond to the “lowest” and “highest” benchmarks used by the EPDC. The pages will show users how to meaningfully link the indicators back to the content of the assessment. For example, documentation will show that the “highest performance benchmark” on Mali’s Beekungo math assessment is the ability to solve a simple word problem.
Additionally, because of the richness of information that is conveyed by looking at the specific math and reading levels used within assessments, the EPDC has decided to make data on assessment-specific levels available as a downloadable spreadsheet separate from our online database. For ASER, UWEZO, and Beekungo, these will be added to the EPDC website in the coming weeks, allowing users to access indicators such as the “% who can read nothing” and “% who can read a story of grade 2 level text.” The EPDC is also planning to add separate downloadable spreadsheets with data on performance at various levels from certain international assessments, such as SERCE/PERCE and SACMEQ, along with indicators calculated from microdata available from these organizations. Be on the lookout for this new learning outcomes data, as well we the upcoming changes to our landing pages.
- Download our UWEZO content indicators here
- Download our ASER content indicators here
- Download our Beekungo content indicators here
Here are some example visualizations that users can easily create, using the new indicators:
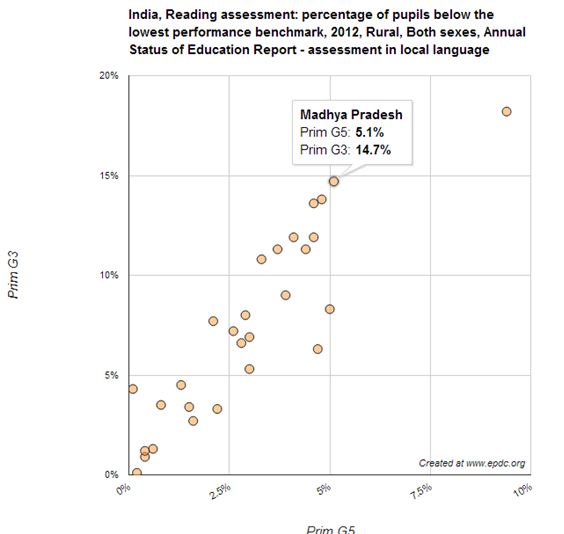
India, % of pupils below the lowest performance benchmark (grades 3 and 5), 2012, ASER
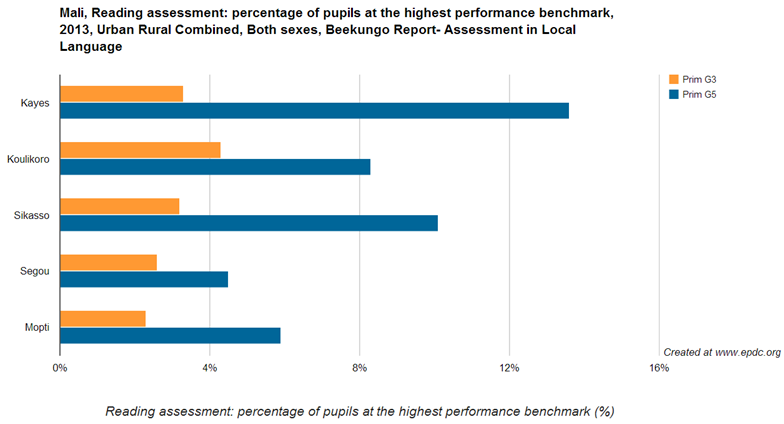
Mali, % of pupils at the highest performance benchmark (grades 3 and 5), 2013, Beekungo
Add new comment