You are here
EPDC National Learning Assessments Mapping: Phase I
EPDC National Learning Assessments Mapping: Phase I
Xuejiao "Joy" Cheng, Intern, Education Policy and Data Center
Charles Gale, Research Associate, Education Policy and Data Center
Background and Purpose
From July 2012 to September 2013, the Center for Universal Education of the Brookings Institution together with the UNESCO Institute for Statistics convened a global consultation group to form the Learning Metrics Task Force (LMTF) with the aim of shifting the post-2015 global education focus from access to access plus learning. In its final recommendation report, the Task Force proposed a global framework of seven key learning domains deemed important for the educational experience of children in all countries. These learning domains are: literacy & communication, numeracy & math, science & technology, social & emotional learning, culture & the arts, physical education, and learning approaches & cognition.
To contribute to the global knowledge base on learning metrics and measurements, and understand the extent to which the learning domains are reflected in existing national exams and assessments, we embarked on a mapping effort gathering meta-data on national assessments from publicly available online sources. In other words, we ask the question: to what extent are the seven domains identified by the LMTF reflected in current assessments and exams? This brief presents the results of Phase I of this mapping project.
Phase I Mapping Process
In Phase I of the project, we selected 53 developing countries from 6 regions of the world[1] and mapped standardized exams and assessments administered at the national level from primary to upper secondary education. To help ensure accuracy of data, data sources are limited to IBE World Data on Education 2010-2011 edition, national education policy documents from IIEP’s Planpolis portal, and where available, ministry of education website as well as national examination agency websites. Aimed at providing as recent information as possible, the mapping project only considers assessments implemented from 2004 onwards; and where information on high-stakes exams (exit and entrance exams) exists for multiple years, only the most recent year of the exam would be recorded[2].
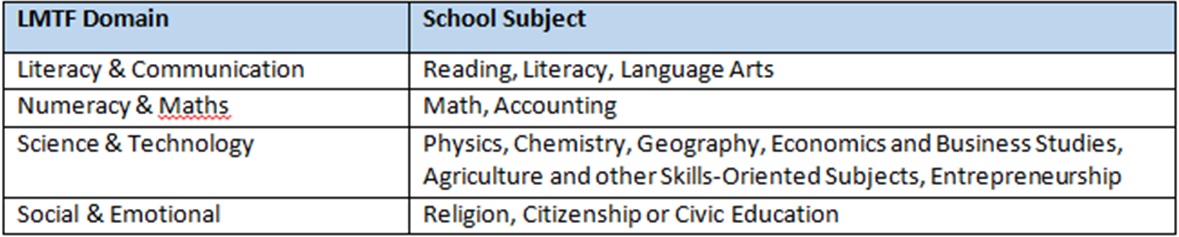
In the process of mapping the subjects tested with the learning domains, EPDC referenced the definition and subdomains for each competency proposed by the Task Force. In cases where subjects seemed to fall within multiple domains, EPDC used discretion in assigning those subjects to certain learning domains, ensuring consistency across the mapping exercise.
Illustrative Example of the Subjects Mapped in the LMTF Learning Domains
Scope of the Phase I Mapping
Information on national learning assessments is not uniformly available across all countries. The following is a breakdown of the assessments identified in Phase I.
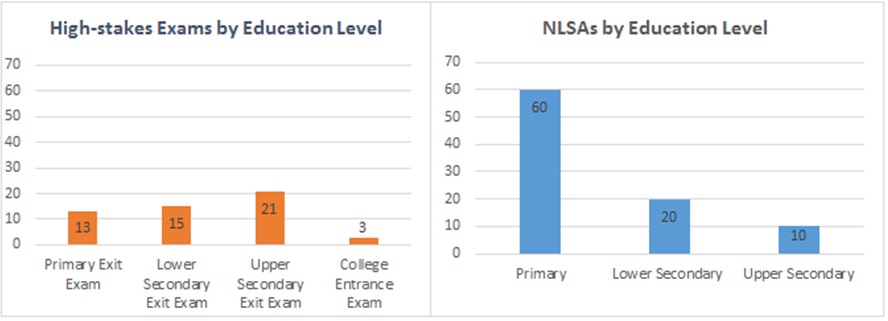
· 171 national-level learning assessments from 42 countries were identified, which we distinguish by type: high-stakes exams, including primary and secondary school exit exams, and college entrance exams; and low-stakes national large-scale student assessments (NLSAs).
· NLSAs are sample-based assessments designed to provide formative information about the state of learning outcomes in a given country, but carry no personal stakes for the student taking the exams.
· High-stakes exams are mandatory, census assessments required for completing a given level of schooling or gaining admission to the next level.
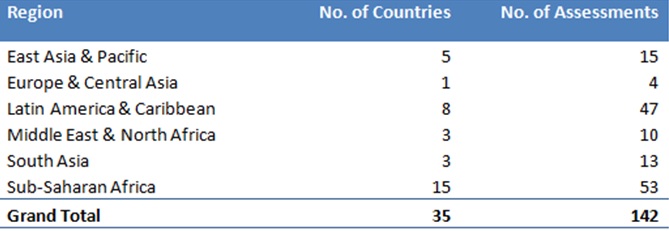
· 142 assessments from 35 countries had information available on the subjects tested, which formed the basis of the learning domain mapping analysis (See graph below for a breakdown of assessments by region).
In terms of assessment types, NLSAs form more than 60% of the 142 national learning assessments, followed by upper secondary exit exams and lower secondary exit exams (see graphs below) . While there are only 3 college and university entrance exams, it needs to be noted that many upper secondary exit exams serve the purpose of college and university selection.
Findings
1: Literacy and Numeracy Competencies still Dominate in National Learning Assessments
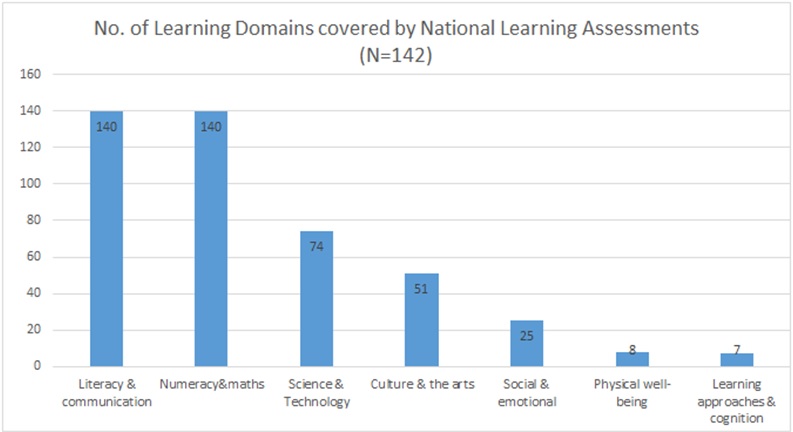
As the graph below demonstrates, unsurprisingly, Literacy & Communication as well as Numeracy & Maths are the two most common LMTF domains covered by almost all assessments. Science & Technology also appears quite frequently, in more than half of the assessments. In stark contrast are the domains of Physical Well-Being and Learning Approaches & Cognition, which only appear 8 and 7 times respectively in all assessments. The Social & Emotional domain also appears quite infrequently, as it’s mostly reflected in the subject of Religion or Civic Education -- tested by a few countries.
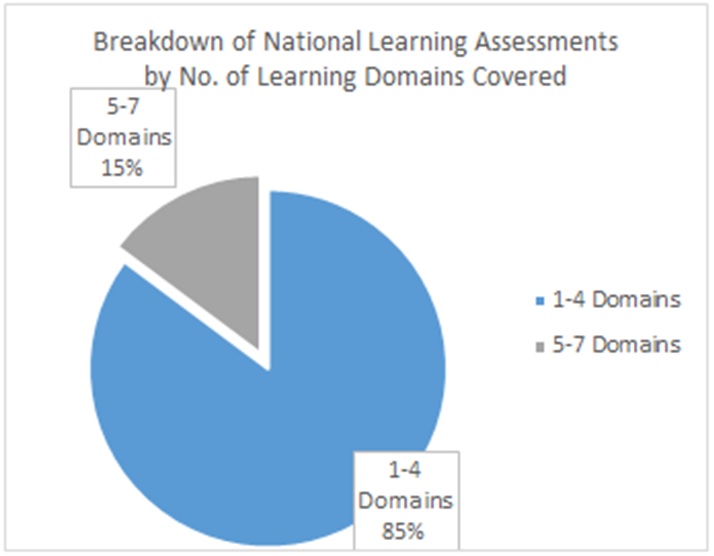
2: It’s fairly rare for countries to cover more than 4 learning domains
As much as the Task Force is advocating for comprehensive learning opportunities in all the 7 learning domains, it’s doesn’t seem to be reflected in countries’ current assessment practice. On average, each assessment tests about 3 learning domains. As can be seen from the graph on the right, it’s uncommon for an assessment to cover more than 4 learning domains -- while 85% of the assessments cover 1 to 4 domains, only 15% cover 5 to 7 domains[4].
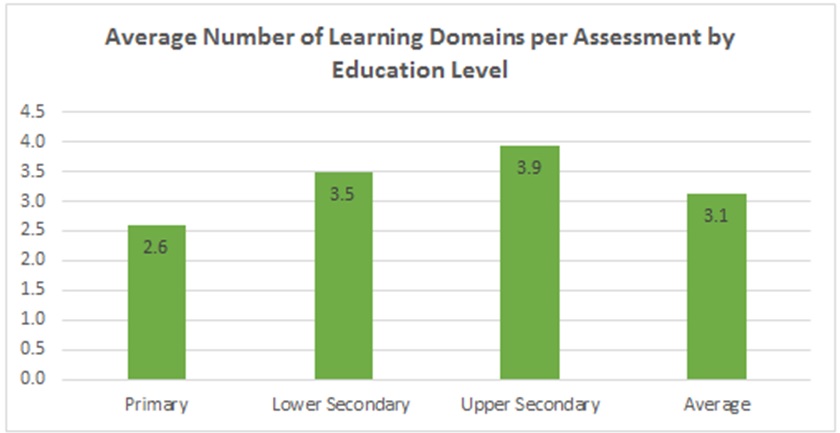
3. The number of learning domains assessed increases with the education level
It is noteworthy that among all assessments, there is an increase of the number of learning domains covered at higher levels of education. As the graph below illustrates, the average number of learning domains per assessment increases from 2.6 at the primary level to 3.9 at the upper secondary level. It seems that countries’ expectation of the breadth of students’ learning increases as they proceed to higher levels of education.
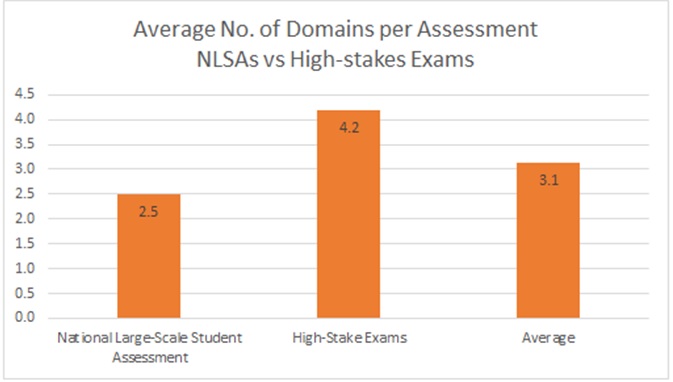
4. NLSAs cover noticeably fewer domains than high-stakes exams
In terms of the number of learning domains assessed by different assessment types, NLSAs coverage are noticeably narrower in comparison with high-stakes exams. It seems typical that countries largely focus on students’ literacy and numeracy performance in NLSAs to understand their learning levels and gauge the effectiveness of the education system.
Next-Steps
In Phase I of the National Learning Assessment Mapping Project, EPDC has covered 53 countries to gain initial understanding of the extent to which countries’ current national assessments reflect the seven learning domains recommended by the Learning Metrics Task Force. Moving forward, EPDC will complete the mapping exercise by focusing on one region at a time. Moreover, for countries that do have learning outcome data from the national learning assessments, EPDC will retrieve and upload the micro data to its learning outcome database to further fill the global learning outcome data gap.
With all the initial findings from Phase I of the mapping project, what does it actually mean for both countries and the global education community in establishing a global learning metric with feasibility and comparability? Keep up to date with EPDC and follow us for an upcoming blog post by EPDC with more discussion on the Mapping Project’s implications.
[1] The 6 regions are: East Asia & the Pacific, Europe & Central Asia, Latin America & the Caribbean, Middle East & North Africa, South Asia, Sub-Saharan Africa.
[2] Different from high-stakes exams, all national large-scale student assessments implemented between 2004 and the present were recorded when information was available.
[3] NLSAs that assess multiple grade levels were counted as separate data points – one NLSA for each grade level.
[4] There is caveat though, as public information may not comprehensively reflect all the subjects covered by the assessments.
Add new comment