You are here
Learning outcomes indicator changes, part 2
Learning outcomes indicator changes, part 2
Rachel Hatch, Research Associate, Education Policy and Data Center
Hugo Van Dyke, Intern, Education Policy and Data Center
At EPDC, we’ve revamped our learning outcomes data collections. The newest additions to the EPDC database are science results from TIMSS and PERCE exams and more detailed disaggregations for international and national math and reading examinations. As mentioned in an earlier EPDC blogpost, we’ve also revised our learning outcomes benchmark indicators so that they apply to a broader range of assessments. We’ve kept other learning outcomes indicators the same, like average score indicators for international assessments and the “words read per minute” indicator from EGRA. The new indicators apply across a range of assessments and simplify data searches in the EPDC database, reducing the number of possible learning outcomes indicators from 26 to 13.
The EPDC database is more streamlined now, but the comprehensiveness of our learning outcomes data remains unchanged. Indicators that were specific to individual tests—such as UWEZO’s “percentage who can read a story”—have been moved to detailed supplementary datasets available for download in the Other Research Documents section of the website. New supplementary datasets with test-specific indicators collected from microdata and reports have been added for ASER, Beekungo, EGRA, PIRLS, SACMEQ, SERCE, TIMSS, and UWEZO assessments.
To help users employ the new benchmark indicators meaningfully, we have updated and added new detailed data notes pages identifying all benchmarks on internationally comparable and country-specific assessments. Visitors should always review the data notes pages when using assessment data. Data notes pages cover issues of comparability and content as well as how an assessment’s benchmark levels line up with EPDC’s indicators.
When using the new benchmark indicators, users should keep several things in mind:
1. Assessments differ in content and level of difficulty.
Internationally comparable assessments, such as TIMSS and SACMEQ, tend to test more advanced content and skills than exams like UWEZO or Beekungo, but EPDC’s benchmark indicators apply to all these tests. Our three benchmark indicators are:
· the percentage of pupils below the lowest performance benchmark
· the percentage of pupils at or above the lowest performance benchmark
· the percentage of pupils at the highest performance benchmark.
Data users should bear in mind that EPDC’s benchmarks are linked directly to the performance levels defined by an assessment and aren’t designed to suggest comparable content across exams. For example, the highest and lowest benchmarks on a test like the ASER-Pakistan reading assessment, which looks at the ability to read a very simple story (without comprehension), are very different than the highest and lowest benchmarks on a test like PIRLS, which looks at more advanced literacy skills. Even where tests are similarly leveled and similar content is tested, the methodologies of assessments are not designed to be comparable to other assessments.
As another example, consider the content differences between the TIMSS 8th grade math assessment and the PASEC math assessment. What does student performance mean on each of these exams? The EPDC data notes pages for TIMSS and for PASEC explain how the benchmark indicators line up with the actual assessment levels. For TIMSS, the highest performance level is the Advanced level, and Figure 1 shows that 3% of Grade 8 students in Armenia achieved that level. According to TIMSS and as documented on the EPDC data notes pages, students who reach the Advanced level have acquired the following skills:
“Students can reason with information, draw conclusions, make generalizations, and solve linear equations. Students can solve a variety of fraction, proportion, and percent problems and justify their conclusions. Students can express generalizations algebraically and model situations. They can solve a variety of problems involving equations, formulas, and functions. Students can reason with geometric figures to solve problems. Students can reason with data from several sources or unfamiliar representations to solve multi-step problems.”

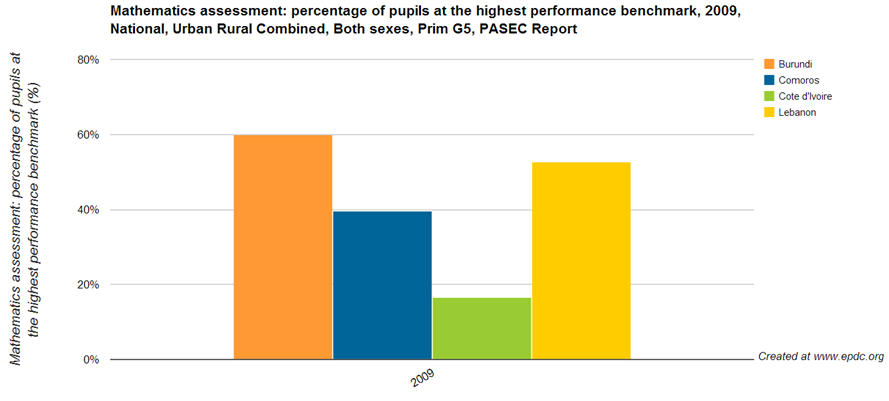
The highest benchmark for TIMSS is different from PASEC, which looks at more basic skills. For PASEC, reaching the highest performance benchmark (Level 3 on the exam) indicates that a student answered more than 40% of test responses correctly, and suggests that he or she has knowledge of basic math principles, such as counting. As shown in Figure 2, 60% of Grade 5 students in Burundi reached this level. Of course, there are important differences in these assessments beyond the content they test (such as the fact that they test different student populations), but their content differences are an important example of why data users should consult the data notes when interpreting learning outcomes data.
2. The same assessment can differ across countries.
Users should also bear in mind that, while some assessments are designed to be comparable across countries, others aren’t. Students sitting for internationally comparable assessments, such as PIRLS, TIMSS, SACMEQ, PASEC, see the same content and the exam is administered in the same manner, so outcomes can be compared across countries. This means, for example, that results from TIMSS assessments in Ghana can be compared to results from TIMSS assessments in Thailand.
However, other assessments like ASER, UWEZO, and EGRA are designed with a country’s curriculum and national context in mind. While they often test very similar content, they are not strictly comparable and sometimes have different benchmarks. For example, the highest performance benchmark for the UWEZO math assessment is multiplication in Tanzania but division in Uganda and Kenya. Also, the difficulty of test items may vary, as with UWEZO, where Tanzania tests addition with carry over while Kenya and Uganda test addition without carry over.
Users can consult data notes pages for more information as well as the assessment websites. Additionally, for the ASER, UWEZO, and Beekungo assessments EPDC has more information available in a summary table as well as sample test items.
3. The same assessment can differ across years.
International exam results are often designed for comparison across years in order to look at trends, but users should consult the data notes pages or the websites of assessments before making such comparisons because not all examples are comparable over time. For example, while the Latin American Laboratory for Assessment of the Quality of Education (LLECE) created both SERCE and PERCE, they caution users not to compare the results from these exams across years. Also, where a benchmark changes from one year to the next, as happened with the difficulty of the ASER-Pakistan division benchmark on the math assessment, it isn’t strictly valid to conduct a time-series analysis.
4. Assessment results may not be comparable across languages.
Some assessments are administered in multiple languages and the assessment methodology considers linguistic differences. In those cases, results can be compared across languages. This is true, for example, of TIMSS and PIRLS assessments as well as across the local language assessments used by ASER-India. In other cases, however, results are not designed to be comparable across languages. For example, issues often arise when comparing EGRA results across languages because learning to read is different in different languages. Additionally, assessments may have alternative benchmarks where multiple languages are assessed. For example, on the ASER English assessments, the highest performance benchmark is reading connected text but on the local language assessment, children need to be able to read a grade 2 level story.
Add new comment