You are here
EPDC Spotlight on Uganda
EPDC Spotlight on Uganda
Each week, the EPDC Data Points blog will highlight a different country and the resources we offer, such as data, country profiles, research or other tools that users have available to them through the website. The fifth post in our series is about Uganda, and Kemi Oyewole provides an overview of education in the country and the data resources we have that are available through our website.
Uganda is a low income, landlocked country in East Africa. The population of Uganda is about 35 million people. A 2012 United Nations report found that Uganda has the world’s largest percentage of its population under age 30, 78 percent. This presents tremendous opportunity for Uganda to educate young people and incorporate them into the economy. However, the ability to produce an educated workforce still requires tremendous investment.
Ugandan children are expected to enter primary school at age six. In principle, the seven years of primary school should be free and compulsory. Elementary schooling is followed by four years of lower secondary school and two years of upper secondary school.
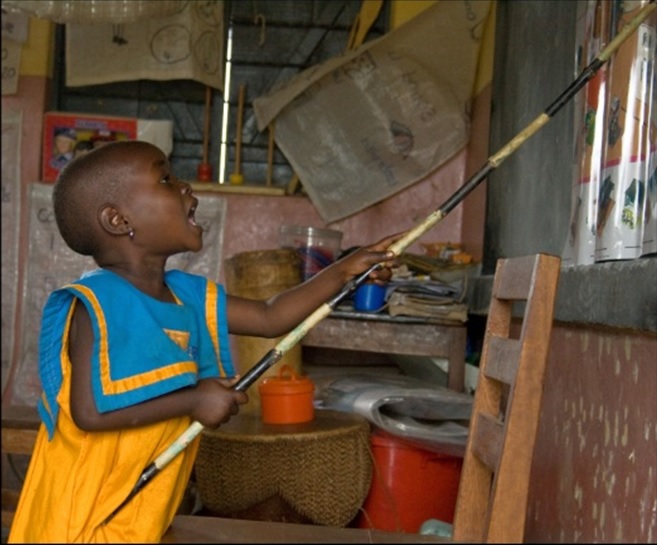 Female School Student in Masindi, Uganda (photography by Matt Lucht)
Learning Outcomes
In Uganda, students sit for the Primary Leaving Certificate Examination at the conclusion of grade 7. Likewise, students sit for the Uganda Certificate of Education and the Uganda Advanced Certificate of Education at the end of lower secondary and upper secondary school, respectively.
The Education Policy and Data Center (EPDC) National Learning Assessment Mapping Project found that Uganda administers the National Assessment of Progress in Education (NAPE), a national large-scale assessment, during grades 3, 6, and 9. The mapping project found that NAPE assess three of the seven dimensions of learning deemed important for learning by the Brookings Institute and UNESCO Institute of Statistics’ Learning Metrics Task Force.
In addition to these national assessments, international and regional assessments are administered in Uganda. These include the Early Grade Reading Assessment, the Southern and Eastern Africa Consortium for Monitoring Educational Quality Assessment, and Uwezo. The EPDC Data Points blog post, UWEZO: Supporting Student Learning in East Africa, discusses Uwezo and presents some findings from the assessment. Data from all of the aforementioned international assessments is available on the EPDC website.
Education Data: A Snapshot
In Uganda, the 2011 primary school completion rate was 52.5 percent for girls and 53.7 percent for boys (Figure 1). The EPDC Projections for Uganda estimate the primary school completion rate will be 62 percent for girls and 58 percent for boys by 2025.[i] These relatively small increases in primary school completion rates suggest little progress towards universal education in Uganda, a Millennium Development Goal set to be achieved a decade earlier in 2015. Thus, there is a need for Uganda to explore creative ways to allow more students to complete basic education.
Figure 1: Completion Rates by Gender
_7_23.jpg)
Uganda’s public education expenditures were 2.6 percent of gross domestic product (GDP) in 2011 (Figure 2). However, this spending is less than the 6.7 and 6.2 percent of GDP spent by Uganda’s largest neighbors Kenya and Tanzania, respectively. This suggests that Uganda needs to devote more of its resources to education in order to spend 6 percent of its GDP on public education as recommended by the United Nations (UN). More nuanced information about education in Uganda is available in its Education Profiles.
Figure 2: Public Education Expenditure as a percent of Gross Domestic Product
_7_23.jpg)
Child Vulnerability
The EPDC Report, Child Vulnerability and Educational Disadvantage in Uganda: Patterns of School Attendance and Performance, builds upon earlier EPDC research to explore the relationship between indicators of child vulnerability and educational disadvantage in Uganda. Uganda serves as a useful case study because it was one of the first countries impacted by HIV/AIDS, has faced a long civil war, and has a large population of children living in urban poverty. The report found that the effects of child vulnerability on educational disadvantage vary according to factors such as age and gender. It follows that some subgroups of students experience educational disadvantage in one dimension and not another. Therefore, understanding the nuanced impacts of child vulnerability in Uganda is essential for policymakers seeking to target interventions to those children most in need.
Issues in Higher Education and Youth Unemployment
Higher education in Uganda is facing a number of obstacles. The first is the very few university places for students in Uganda. Another is the substantial discontent from students about rising fees and faculty about inadequate funding. Yet the most striking crisis is incredibly high youth unemployment, even among those students who do enter and complete university. Many say that this unemployment is a product of a skills mismatch between the education universities impart and the skills the market requires. Professor Augustus Nuwagaba believes that Uganda “is stuck with the colonial education system that trains students to be clerks, teachers and lawyers … [while] the country needs metal fabricators, carpenters and mechanics.” Professor Nuwagaba’s sentiment seems to be shared by international institutions such as World Bank. In late 2013, the World Bank proposed a $75 million loan targeted towards skill development in Uganda.
Similar skill development initiatives are also being incorporated into the Albertine Region Sustainable Development Project (ARSDP). The project focuses on ensuring the benefits of oil and gas resources in the Albertine Rift Valley are experienced by local communities. One of the central components of ARSDP is: business, technical, and vocational education and training. This element of the plan centers on upgrading the quality of formal training in the region. Additionally, ARSDP includes the establishment of linkages between the private sector and educational institutions to ensure the skills taught meet employer standards. Hopefully such investment and planning is successful and can serve as a model for increasing rates of youth employment.
EPDC Resources
Among other sources, unique EPDC data collections for Uganda include data from the Bureau of Statistics (2009, 2010), Ministry of Education and Sports (2003-2009), USAID Demographic and Health Surveys (1995, 1999, 2000, 2001, 2005, 2006, 2011), Early Grade Reading Assessment (2009), Southern and Eastern Africa Consortium for Monitoring Educational Quality Assessment (2003, 2007), Uwezo (2010, 2011), and other indicators derived from the UNESCO Institute for Statistics. The EPDC website offers users the opportunity to create graphs, charts, and other visualizations of data with an easy-to-use tool.
[i] Completion rates are calculated as: the total number of student completing (or graduating from) the final year of primary education, regardless of age, expressed as a percentage of the population of the official primary graduation age.
Add new comment