You are here
Literacy data: more, but not always better (part 2 of 2)
Literacy data: more, but not always better (part 2 of 2)
Elizabeth Buckner, Research Associate, EPDC; Rachel Hatch, Research Associate, EPDC
This post is adapted from EPDC's latest polic brief, Literacy data: more, but not always better. In part 2 of 2 posts, we discuss some of the measurement issues in determining literacy as applied to the context of Uganda.
This section highlights the difficulties we face in trying to assess the state of literacy in a specific country context. We examine literacy in Uganda because it is one of the few countries where data on literacy is available from multiple sources for roughly the same student population in the same year. Literacy data is available for 3rd and 6th grade students drawn from UWEZO, EGRA, SACMEQ and Uganda’s national assessment, the National Assessment of Progress in Education (NAPE). EGRA data is only available for the Central region of the country, and can be compared to UWEZO data, which disaggregates data by subnational region. All tests assess literacy in English, and data on literacy in local languages is also available in EGRA and NAPE.
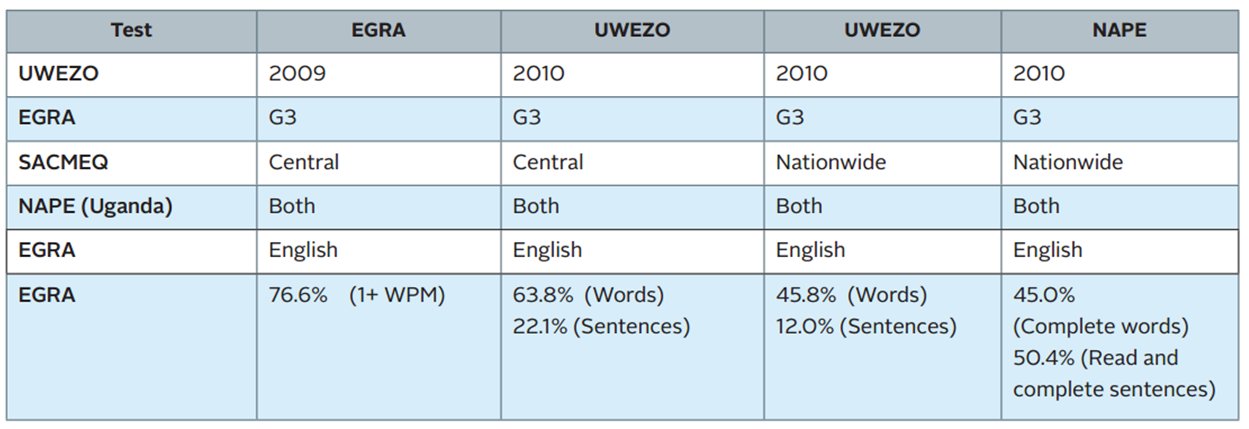
We start with a basic question that educators, international development observers, and government professionals may all be interested in: how well can Ugandan children read? To begin to answer this question with data, we specify our age range and select one specific literacy skill: what percent of Ugandan 3rd graders can read connected text (i.e., words and sentences)? As Table 3 on the next page shows, there are at least three sources of data on this question –all designed to answer this exact question. Both the 2010 UWEZO and 2010 NAPE have indicators on students’ abilities to read words and read sentences. EGRA data is only available for the Central region, and is therefore compared to findings from UWEZO in the Central region.
Grade 3 literacy data for Uganda (see policy brief for a similar comparison for grade 6)
Different Definitions of Literacy
The tables shed light onto how difficult it is to understand the state of literacy even in a clearly identified population. In Table 3, among 3rd graders in the Central region, EGRA finds that 76.6% of students can read at least one word, while UWEZO finds that only 63.8% of children of this age can read words. This discrepancy may be due to the fact that UWEZO is based in households, and so likely includes students who never made it to Grade 3.
In addition, comparing UWEZO to the Ugandan NAPE, findings are quite different from one another, in part because the NAPE’s literacy indicators are not clearly defined. One of the sub-competencies tested is the ability to “complete words” and a second is the ability to “read and complete sentences”. While only 45% of students can complete words, 50.4% can read and complete sentences. In most tests, the ability to read sentences would be expected to be lower than words, so the NAPE’s findings are confusing. It is possible that the sentences used in the NAPE exam are closely linked to the curriculum, and that students may be able to succeed on these questions due to memorization rather than general literacy skills. Alternatively, these competences could be based on texts of very different difficulty, but the difficulty of the texts is never explained. Similarly, in the 6th grade NAPE exam, 53.4% were able to “read and describe activities in a picture,” while only 31% were adequate or advanced at “reading a story.” The differences in these two activities is never made clear in any report or public documentation.
The discrepancies found between tests may be due to varying definitions of literacy used: some tests emphasize skills and competencies associated with the practice of reading, while others focus on comprehension. SACMEQ’s definition of “Reading for Meaning” is defined as “reads on or reads back in order to link and interpret information located in various parts of a text.” In contrast, NAPE’s definition is based on a composite of indicators and incorporates skills such as matching and comprehension. The take away is simply that how we define literacy matters in terms of our understanding of who is literate in a given context.
Language Matters
The Uganda case also provides an opportunity to examine literacy within the same population of students in more than one language. The table below extracts indicators on literacy in three languages, from two sources: NAPE and EGRA. The table examines different definitions of literacy in two separate regions — the Luganda-speaking region and the Lango-speaking region within the same test.
Side by side comparison – Literacy in different languages (grade 3)
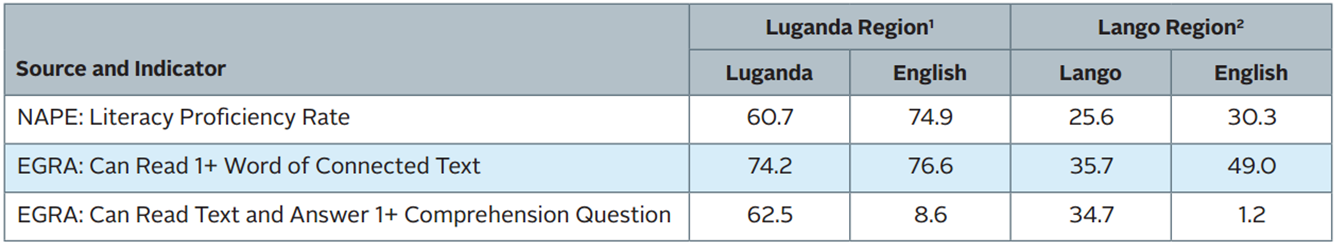
We do not suggest that the indicators from the two tests be directly compared in this case –as they could be drawing from Luganda speaking students in the Central region or the Northern region. However, we can make comparisons across languages within the same test. The EGRA data show that among the same students, phonemic awareness is higher in English than local languages, but comprehension is substantially lower. Additionally, the literacy assessment used in Uganda’s NAPE finds that students are generally more literate in English than their local languages, excepting a few regions and languages, which suggests that some regions are better at teaching literacy in local languages than others – but also makes it difficult to draw conclusions about the state of literacy generally. Definitions of literacy depend crucially on what skills are tested and what language they are tested in. It is important to test a variety of skills, including comprehension, and a variety of languages, as EGRA Uganda report notes: “children able to “read” in English do not understand the meaning of the words they have learned” (Piper 2010, p. 5).
What is Needed?
The more we measure literacy, the more data we have – but unless definitions and levels of literacy are both clarified and standardized, the more confusion these numerous indicators can create. Although it is unreasonable to expect the international educational community to come to complete consensus on any one definition of literacy, researchers should map out how different assessments’ literacy levels map onto others, and which sub-set of literacy skills each assessment is testing. On the other hand, it is also possible that the move to measuring literacy along a spectrum of skills offers room for advancing understandings of literacy – instead of forcing literacy assessments to map onto older definitions of “literate/illiterate,” it may be time to re-conceptualize how we report on literacy statistics. For example, countries may increasingly seek to report the percent of students who are literate at either a basic level or and advanced level, to give more clarity and nuance to their own literacy statistics. On the other hand, it is also possible that the move to measuring literacy along a spectrum of skills offers room for advancing understandings of literacy – instead of forcing literacy assessments to map onto older definitions of “literate/illiterate,” it may be time to re-conceptualize how we report on literacy statistics. For example, countries may increasingly seek to report the percent of students who are literate at either a basic level or and advanced level, to give more clarity and nuance to their own literacy statistics.
Add new comment