You are here
EPDC Spotlight on India
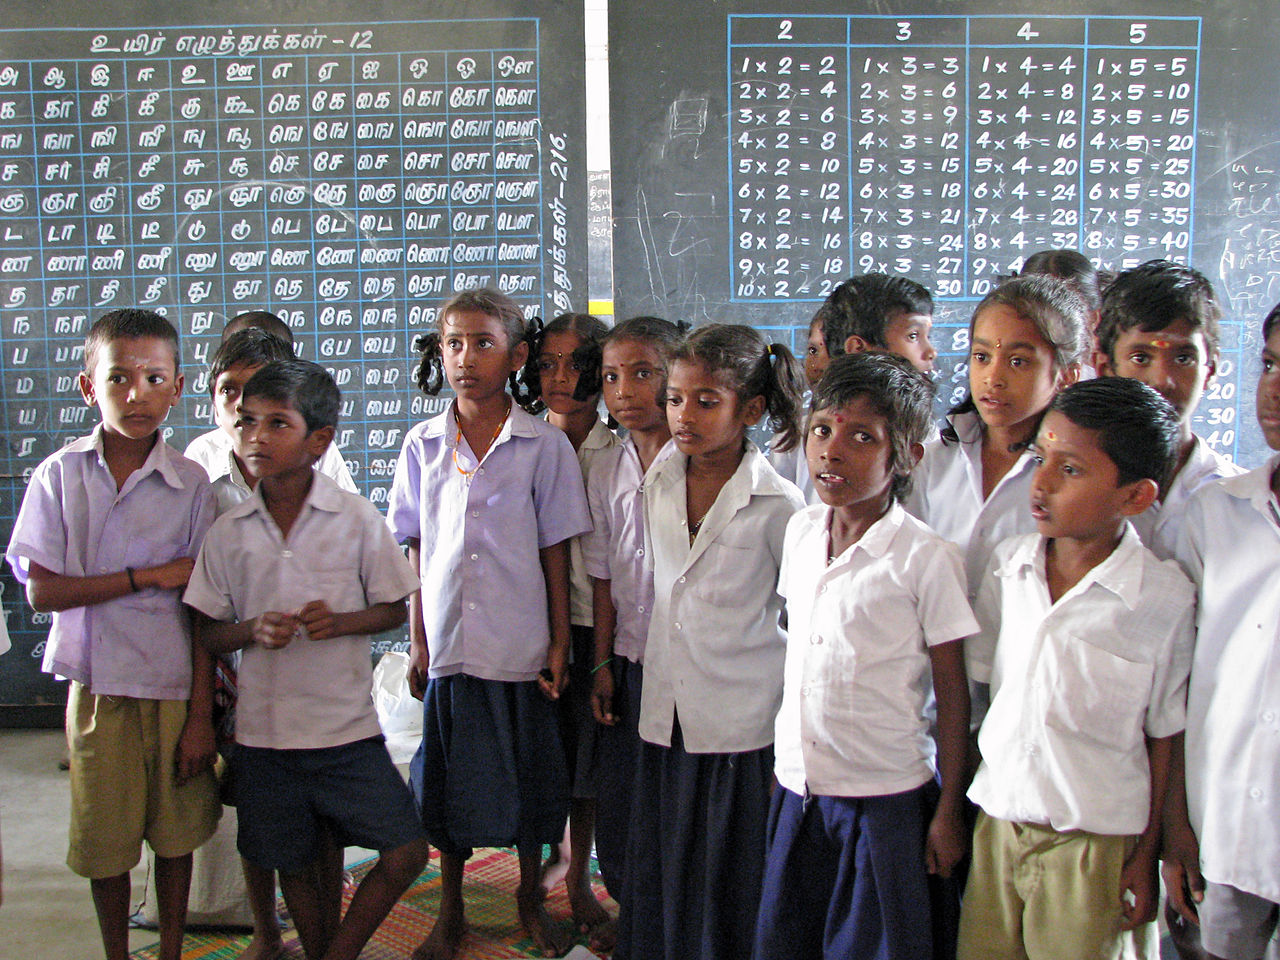
India, classified as a lower middle income country by the Work Bank in 2014, is the second most populous country in the world with 122.5 million children of primary school age and 167 million children of secondary school age. According to the UNESCO Institute for Statistics (UIS), in 2011 there were 3.9 million teachers in primary schools and 1.9 million teachers in lower secondary schools. In India, the official primary school entrance age is 6 and education system is structured as 5-4 and 3-year cycles respectively for primary, lower secondary and upper secondary school. Students sit for certificate examinations at the end of grades 8, 10, and 12.
EPDC’s National Country Profile for India shows where India stands in comparison to other low and middle income countries in access to education and in education quality. Compared to other countries, India ranks at the 61 percentile in access, measured as the primary school net enrollment rate, and at the 29 percentile in learning, measured by youth literacy. This trend of relatively higher enrollment rate compared to poorer learning outcomes in India have played out in debates around passage of the 2010 Right to Education Act, requiring all children aged 6 to 14 to attend school for free, while giving less attention to the issue of education quality.
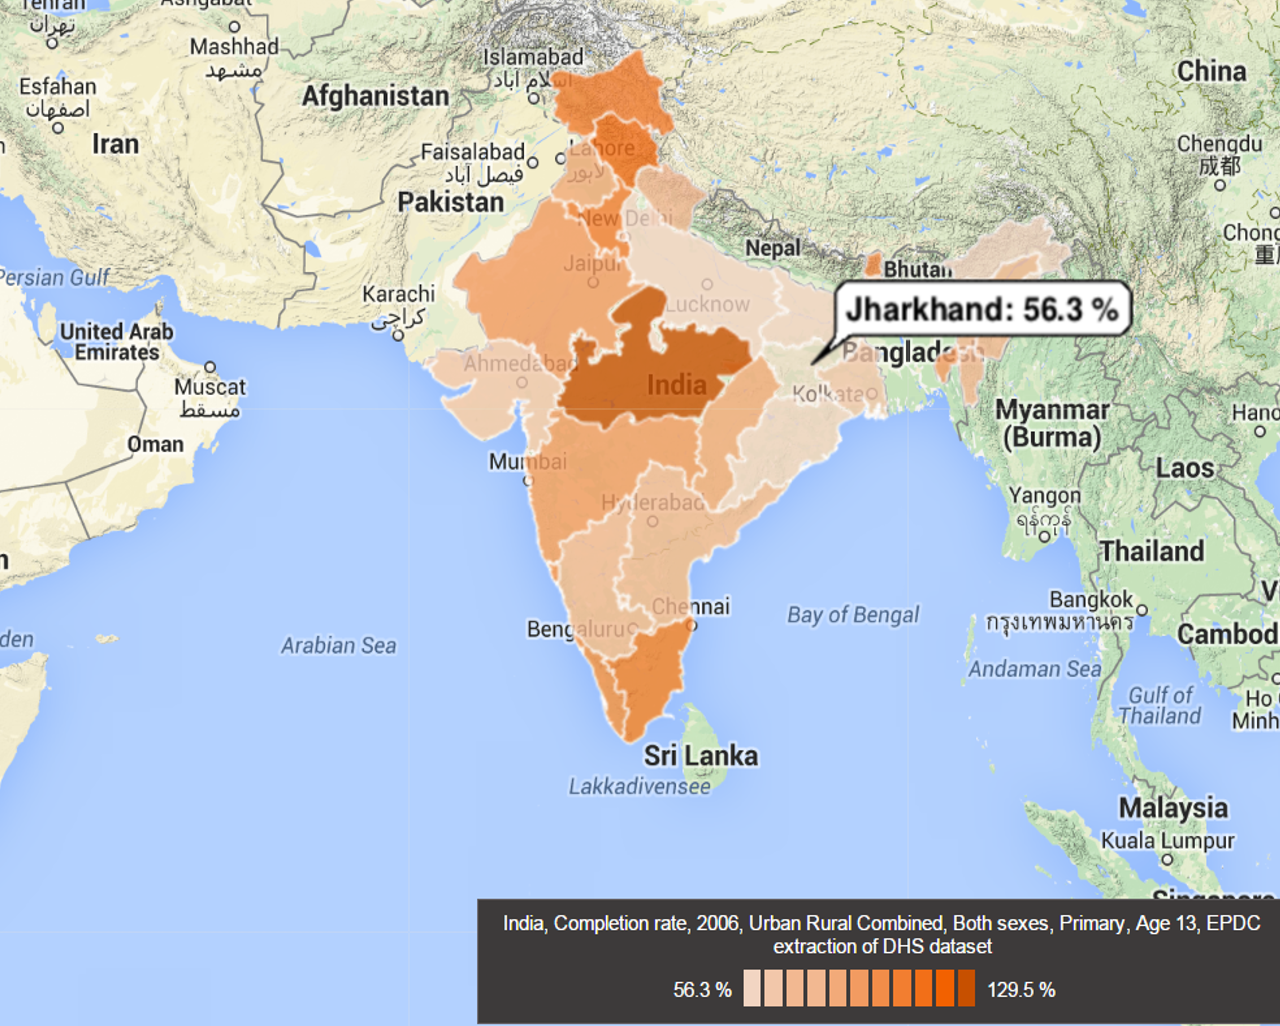
Behind the steady growth of enrollment rate is the fact that disparity of education still exists across India. According to EPDC extractions of the most recent DHS dataset, the completion rate of primary school ranges from 56.3 in Jharkhand to 129.5 in Madhya Pradesh. Additionally, regardless of disparity in sub-national areas, EPDC Projections for India estimate that the primary completion rate will remain below 90% in 2025, suggesting India faces a challenge in ensuring that all children finish primary education, not that they simply have access to it.
Figure 1 Primary Completion Rate by Sub-national Areas
Learning Outcome
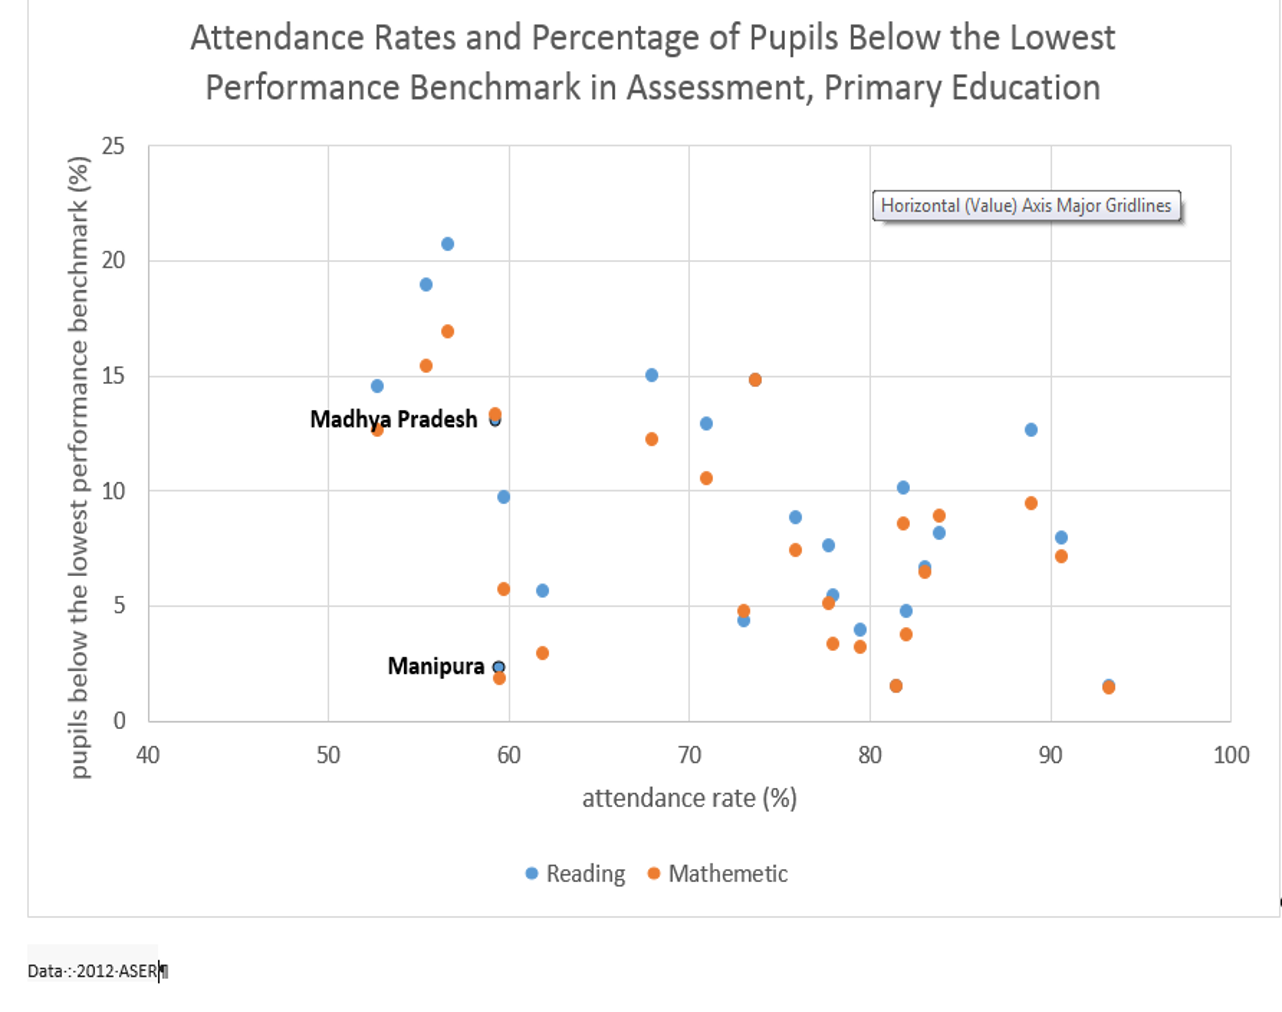
As mentioned previously, there has been a large debate in India over the quality of schooling, as the country makes moves toward achieving universal enrollment. One “watchdog” organization which has provided commentary in this debate is Pratham, which commissions the Annual Status of Education Report (ASER). Based on data of sub-national areas from the 2012 ASER, figure 2 explores the relationship between attendance rates[1] of primary education and the percentage of pupils below lowest benchmark in reading and math assessment. Our analysis indicates that although the attendance rate is negatively related to poor performance of both reading (r=-0.52) and math assessments (r=-0.46), the correlation is not as strong as expected. In addition, even in states with the same attendance rates, there might be a huge disparity in learning outcomes across states. For example in both Manipura and Madhya Pradesh, attendance rates are 59%, although students differ in their assessment competencies. Compared to only 2.3 percentage of students in Manipura, 13.2 percent of primary students in Madhya Pradesh scored below the lowest benchmark in the reading assessment. Thus, this analysis implies that reasons other than low attendance, such as infrastructure and quality of teachers, need to be further analyzed to explain the gap in learning outcomes across India.
Figure 2 Attendance rates and pupils below the lowest performance benchmark in assessment, by States
Inequality in Education in India
In economics, the Lorenz Curve is used to measure income inequality by showing the percentage of total income distribution that a given percentage of households have. A perfect 45-degree line is called an egalitarian line, showing perfect equality of wealth distribution. Any Lorenz curve beneath the egalitarian line indicates some extent of social inequality.
Research finds that inequalities in educational attainment can be also illustrated by a Lorenz curve with a similar approach of determining inequalities in household income (Thomas & Wang, 2001). Thomas and Wang further claim that assuming talent and ability are normally distributed across population in a country, production reaches an optimum level when the distribution of education matches the distribution of human ability.
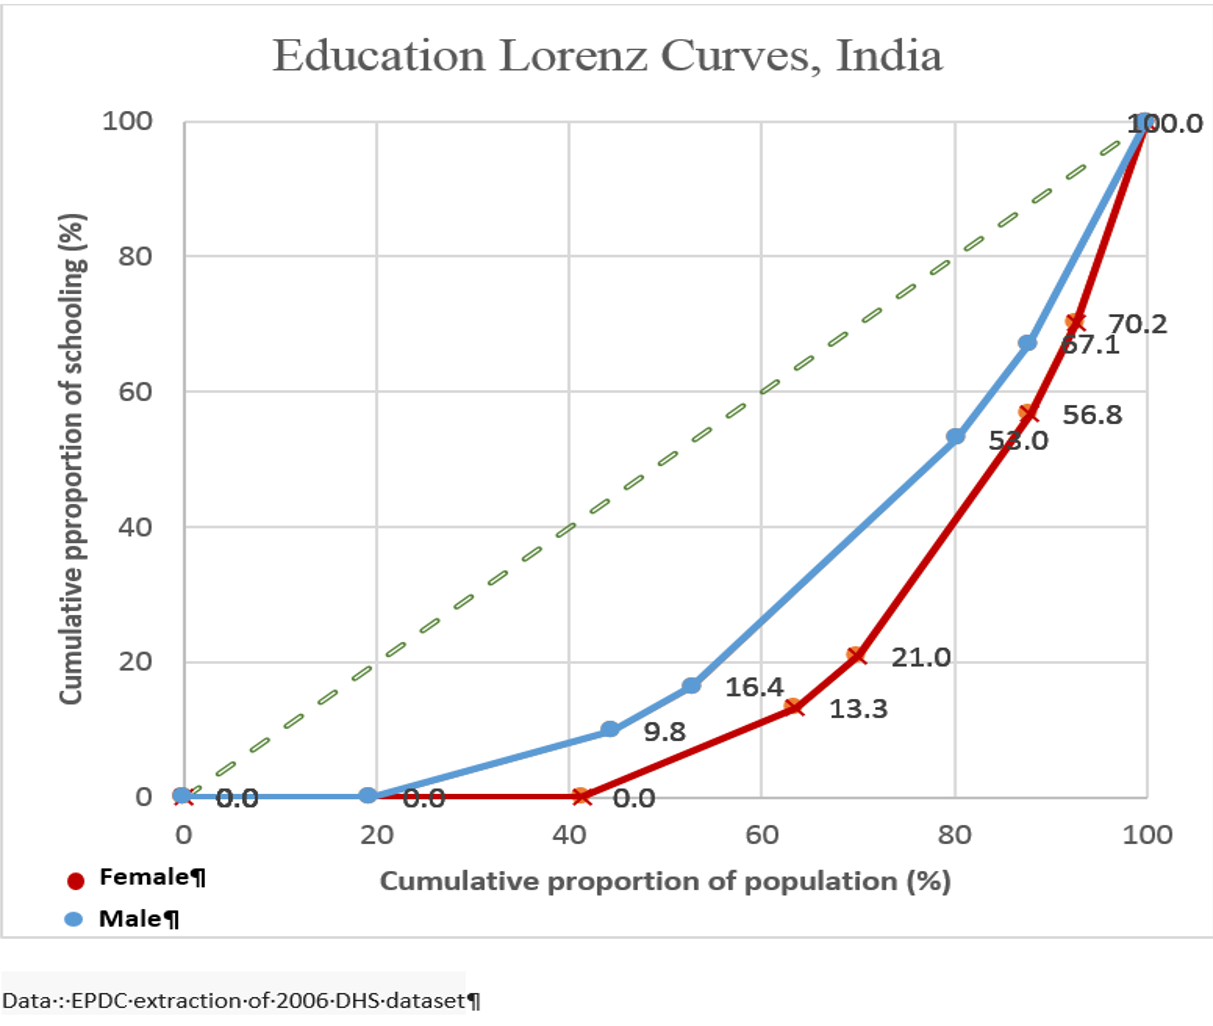
Figure 3 shows the distribution of educational attainment between genders in India in 2006. The data we used were extracted from ASER 2012 publication. For the purpose of calculating total years of schooling, we assumed 2.5 years of schooling for primary education incomplete, 8.5 years of schooling for secondary incomplete and 17 years of schooling for post-secondary education. The curves truncated along the horizontal axis show that despite the tremendous effort of the Indian government to eliminate illiteracy, nearly 20 percent of males and 40 percent of females in the 15-49 age group have no schooling at all. Additionally, compared to the education Lorenz curve for males, the female curve is more skewed from the egalitarian line, indicating a large gender disparity of education in India in addition to the large illiterate population.
Further, as both the female and male Lorenz curves skew away from the egalitarian line, this suggests a social loss from the underutilization of potential human capital, which means production has not achieved optimal allocation due to some groups of population only having limited or no education. To create further social-economic growth and increase productivity, there is an urgent need to shift the education Lorenz curves toward the egalitarian line. In other words, an important policy course in the drive to promote access will be to ensure that both genders enjoy access to education equally.
Figure 3 Education Lorenz Curves in India, by Gender
EPDC Resources
Among other data sources, unique EPDC data collections for India include administrative data from the Department of School Education and Literacy (2003 - 2007), Ministry of Human Resource Development (2005 - 2008), household survey data from DHS (2006), Pratham (2005), SES (2004), IPUMS (1999, 2004), indicators derived from UIS data, and learning outcomes data including ASER (2005-2006, 2008-2012).
[1] Gross attendance rates are available in the ASER 2012 publication
Add new comment