You are here
Horizontal Inequalities in Education: the Education Inequality and Conflict (EIC) Dataset
As part of a recent study on the relationship between horizontal education inequality and violent conflict commissioned by UNICEF's Peacebuilding, Education and Advocacy Programme, FHI 360’s Education Policy and Data Center (EPDC) examined the following research question: Are countries where some ethnic or religious groups have systematically lower levels of education more likely to experience civil conflict than those where all groups have equal access to school? The findings reveal a statistically significant and quantitatively large relationship between ethnic and religious inequality on likelihood of conflict in the 2000s. While this effect comes out powerfully in the years since 2000, it is not present in the 1970-1990 period. In contrast, subnational educational inequality is a strong predictor of civil war regardless of the time period.
The Education Inequality and Conflict (EIC) Dataset was constructed to answer the above research question and contains measures of horizontal inequality in education, across ethnic, religious, and subnational divisions for 97 countries from 1960-2013. It also includes information on the onset and incidence of civil conflict in country-year format.
The EIC dataset was also the data source used to construct EPDC’s Education Inequality Profiles. The profiles were constructed for 16 countries in which FHI 360 has ongoing education projects and for which data on education inequalities could be compiled. The profiles portray data for 15-24 year olds by ethnic, religious, and subnational composition for the following indicators: Group Gini (GGini) Index, educational attainment, and mean years of schooling.
A Snapshot of the Dataset
The EIC Dataset:
· contains several measures of horizontal inequality in the educational attainment of young people (ages 15-24) across ethnic, religious, and subnational divisions, disaggregated by gender
· spans 1960-2013 and includes data from 97 countries
· of these, 62 different countries experience at least one new conflict onset
· 66, equal to roughly two-thirds (68%), experience a conflict incidence at some point in the time period
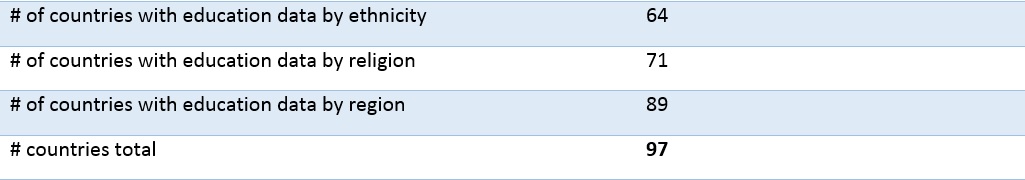
The final dataset has 16,437 data points, drawn from 3,612 country-year observations. Figure 1 displays the dataset coverage by ethnicity, religion, and subnational group, with the number of countries with education data for each of the dimensions also listed in Table 1.
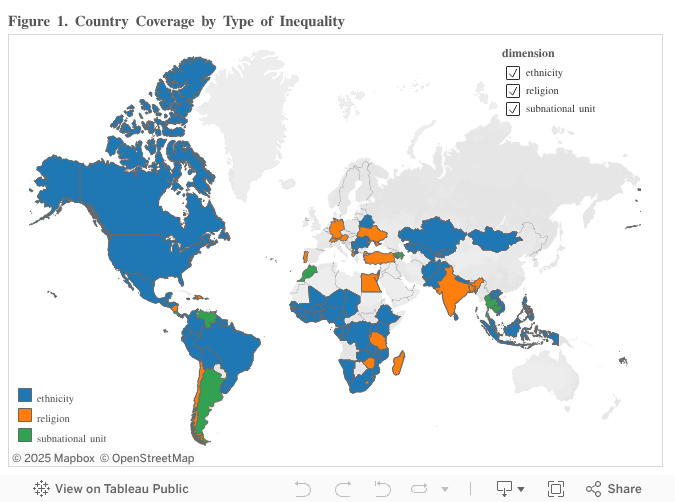
Table 1. Country Coverage by Type of Inequality
Why educational attainment?
The education inequality measures in this dataset are based on data on educational attainment, by level, and mean years of schooling, disaggregated by ethnic, religious, subnational group, and gender, with the final analysis focusing on mean years of schooling. The choice in favor of educational attainment, as opposed to literacy or resource inputs, was made due to the availability and coverage of educational attainment information in surveys and censuses, and the possibility of disaggregating attainment by subgroup. No other indicator currently used in education – neither access, nor quality, nor resources – can rival the coverage and depth of educational attainment information. In addition to this basic practical reason, there is a theoretical basis for examining educational attainment, as it is useful in providing a gauge of the level of human capital stored in a particular subpopulation.
The information compiled in the EIC dataset come from individual-level records of educational attainment, demographic information and household assets, included in three primary datasets:
· The Integrated Public Use Microdata Series International (IPUMS International)
· Demographic Household Surveys (DHS), and
· Multiple Indicator Cluster Survey (MICS)
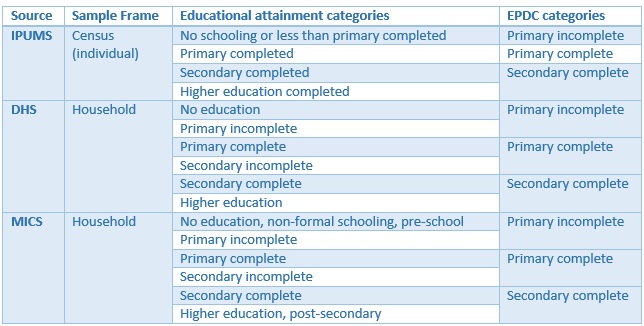
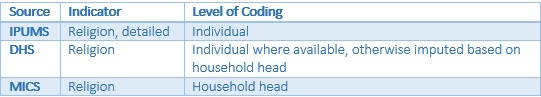
The datasets used differ in terms of how they determine educational attainment. Thus, a decision had to be made about the grades that form the cut-off points at which someone can be considered to have completed a given level of schooling. For the construction of these datasets, EPDC used internationally standardized variables when possible. When it was not possible, individuals’ attainment was determined by consulting information on the structure of the national education system. Table 2 provides an overview of how education categories used in the IPUMS, DHS and MICS were transformed into the corresponding categories used by EPDC.
Table 2. Overview of Educational Attainment Measures
The Outcome Variable: Measuring Violent Conflict
The measure of violent conflict included, conflict onset, is borrowed from the Uppsala Conflict Data Program (UCDP) datasets. We use the onset variable from the UCDP Onset of Intrastate Armed Conflict, which spans 66 years (1946-2011), and includes annual observations on conflict onset in over 180 nations (Themnér and Wallensteen 2012). In the UCDP Onset dataset, conflict is defined precisely as at least 25 battle-related deaths in one calendar year and onset means a new outbreak after a period of peace.[1] To supplement the dataset with the most recent available data, conflict onsets for 2011-2013 were coded using UCDP definitions.
Following the common practice in the conflict literature, a definition of conflict onset that includes a two-year lag is adopted: in other words, incidence is coded as new onset if at least two years have passed since the last observation of the conflict. This definition is widely used; however, it also may introduce artificiality to the idea of onset in the case of protracted conflicts.
Harmonizing Horizontal Inequality Groups across Datasets
Ethnicity
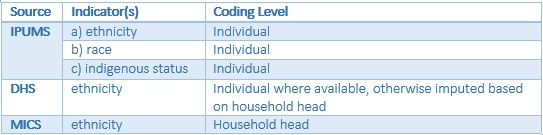
Ethnicity coding varied across datasets. In most cases, the types of ethnicity variables available from a given dataset reflected the priorities placed by census or survey design specialists and therefore may miss other ethnic groups potentially present in the population. Proxy variables, such as “race” or “indigenous status” were sometimes used by the surveys to identify ethnicity (in DHS), and imputation was done for members of the household based on the ethnicity of their household head in some datasets (MICS). Table 3 provides an overview of ethnic group coding information:
Table 3. Overview of Ethnicity Coding
Religion
With respect to religion, EPDC used the most detailed version of religion disaggregation that could be obtained. Worldwide, identity-based differences often emerge along sectarian lines even within the same major religion (e.g., Protestant-Catholic, or Sunni-Shia divides). For this reason, preference was given to a variable that groups individuals not only into major religious group, but also into denominations or sects of the same religion. Table 4 provides an explanation of religion coding that was used in the dataset.
Table 4. Overview of Religion Coding
Subnational
Individuals were classified into subnational regions based on the largest administrative region available in the data. To permit a time-series analysis, subnational regions were harmonized using a series of publically available official information on subnational regions. It is thus important to note that “subnational regions” in the EIC datasets may not reflect the actual administrative regions of a country.
The Key Predictor Variable: Measuring Horizontal Inequalities
The primary measure of horizontal educational inequality at the country level is the Group Gini (GGini) index. The index is based on the size of the differences between group averages within a given country, year, and type of inequality (i.e., ethnic, religious, and subnational) and the group’s relative size as a proportion of the country’s population. The GGini based on mean years of schooling can be interpreted as a measure of how concentrated the total stock of education is in any one group or region. A GGini of 0 would mean that all groups or regions have the same mean years of schooling, while a GGini of 1 can be understood loosely to correspond to a situation where one group or region has essentially exclusive access to all the education in the country, to the detriment of all other ethnic groups.
Table 5 provides summary statistics of the GGini by identity group. In our dataset, the GGini ranges from 0-0.58. Most of the values fall between zero and 0.1 and a relatively small number of outlier observations at the upper end of the distribution fall above 0.5. This tighter distribution is expected, as our measure captures the differences between group mean values in the years of schooling, rather than the disparity between individuals.
Table 5. Summary statistics for Group GINI by group type
.jpg)
Nonetheless, because we are measuring inequality using mean years of schooling for identity groups and regions as a whole, even a small difference in horizontal inequality can mean real differences in the life opportunities of members of different groups. A one year difference in mean years may translate into the difference between graduating high school, and receiving the concomitant benefits, and not graduating.
Trends in Horizontal Educational Inequalities
Analyzing the GGini index and educational attainment data revealed the following trends in horizontal educational inequalities.
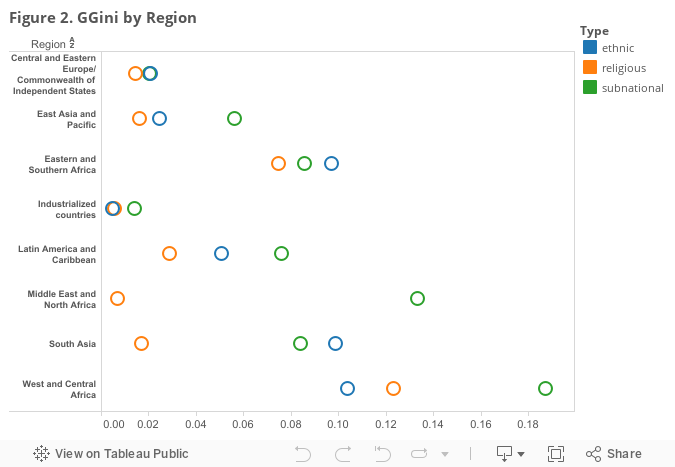
1) Inequality is generally higher among geographic subnational units than it is for the identity-based groups, religion and ethnicity. This is generally true in all world regions, as shown in Figure 2, with the exception of Eastern and Southern Africa.
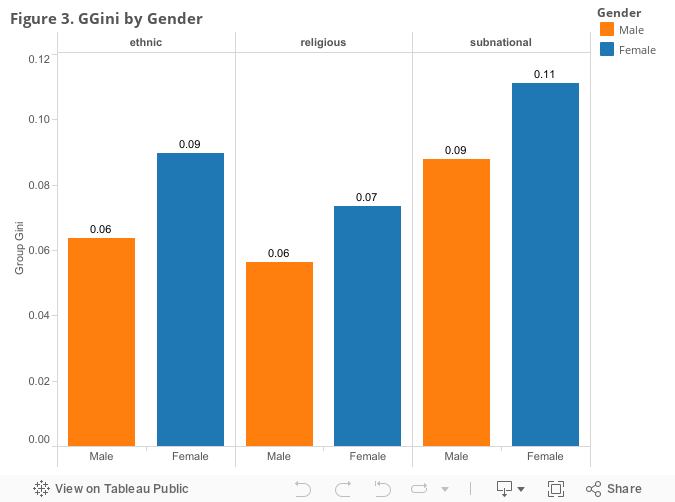
2) Across the board, inequalities among women are larger than those among men, with somewhat wider gaps along the ethnic dimension (Figure 3). However, the gender-disaggregated GGini indices are highly correlated, which indicates that where inequality is high in one gender, it tends to also be high in the other.
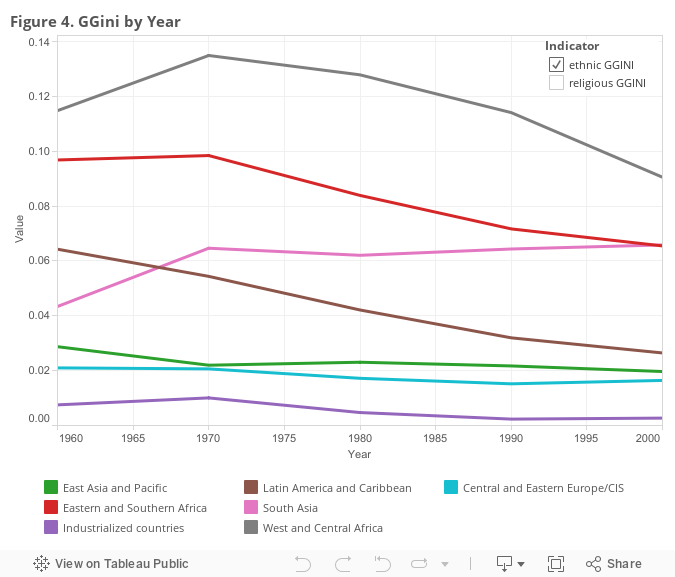
3) Around the world, access to education has increased dramatically over the last five decades. As enrollment in education systems has grown, the stock of human capital, measured in years of schooling, has become more equitably distributed. The most dramatic declines in horizontal inequalities have occurred in countries with the highest horizontal inequalities in the 1960s, particularly in Africa.
Explore the Data
Use the data to explore the relationship between inequalities in educational attainment and other development indicators or vice versa. You can view visualizations for the mean years of schooling and educational attainment data for 16 countries in EPDC’s Education Inequality Profiles and explore two interactive visualizations of the data in our recent blog post.
You can also download some of the data from our online database. You can search the data by country or by indicator (select "average years of schooling" as the indicator under the topic "literacy and educational attainment"). Mean years of schooling data for ethnic and religious groups can be downloaded as an excel file here.
Please email epdc@fhi360.org if you would like a copy of the entire dataset.
[1] UCDP defines armed conflict as follows: “an armed conflict is a contested incompatibility that concerns government and/or territory where the use of armed force between two parties, of which at least one is the government of a state, results in at least 25 battle-related deaths in one calendar year” (UCDP 2014).
Add new comment