You are here
The World Education Forum Focuses on Learning Outcomes and Educational Inequities

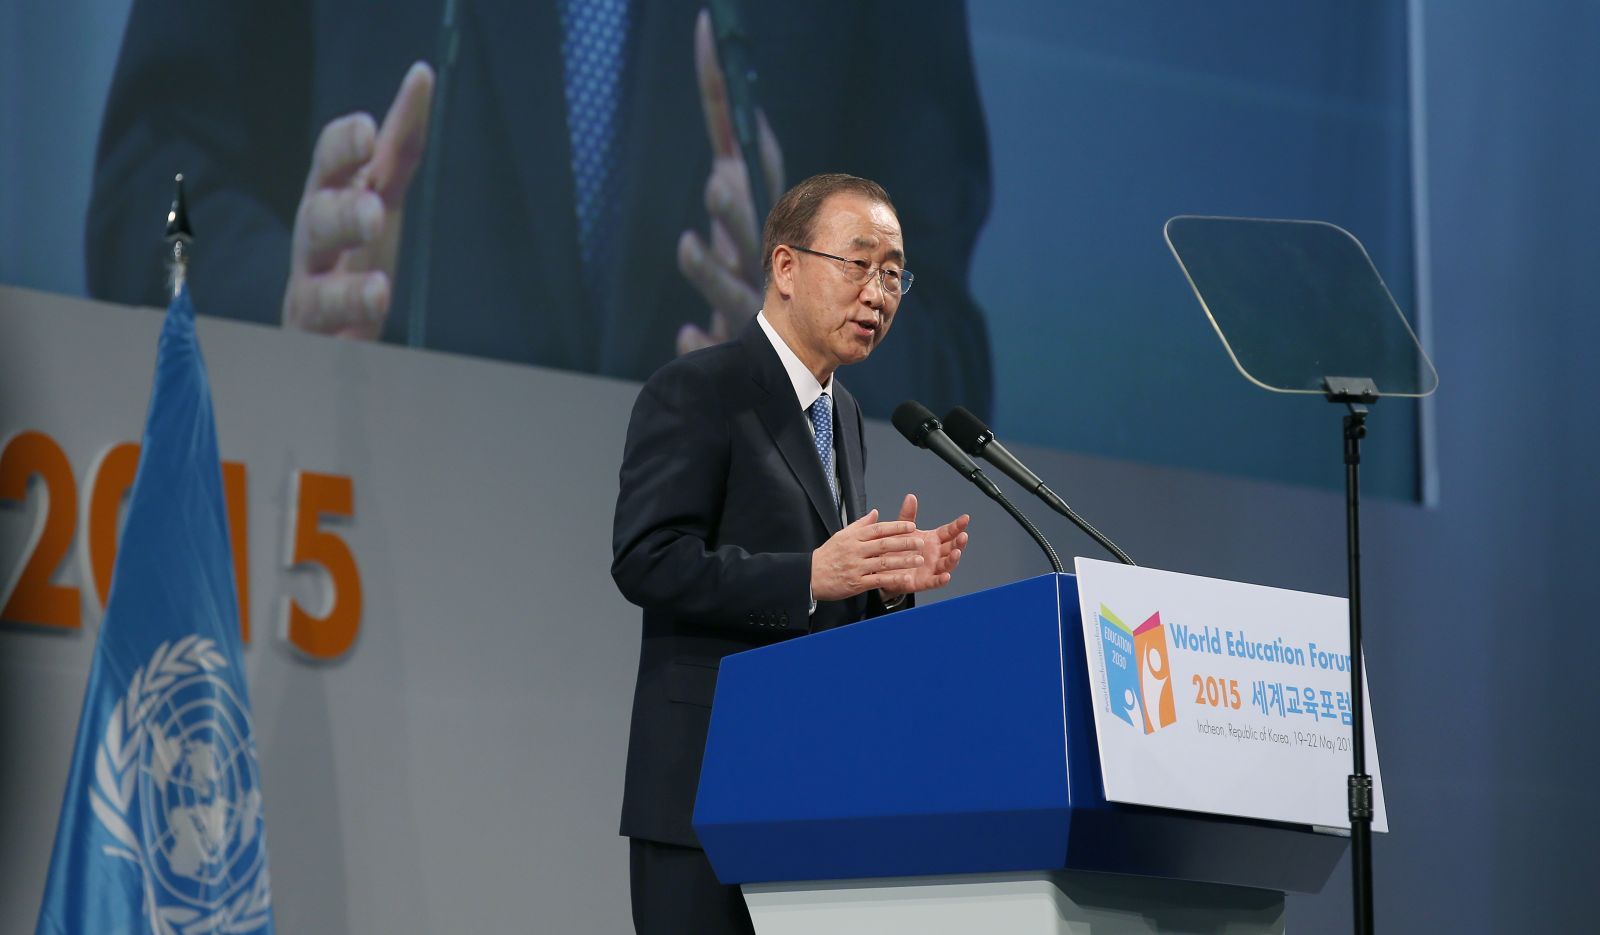
From May 19-22, in Incheon, South Korea, the World Education Forum (WEF) convened world leaders and stakeholders in education to plan a "post-2015" global education agenda. The two main distinguishing factors of the post-2015 global education agenda from the goals agreed upon in 2000 are an overarching focus on measuring learning outcomes and educational inequities over the previous, almost exclusive focus on access, participation, and completion.
This recent emphasis on learning outcomes and educational inequities ties into the 2015 Global Monitoring Report’s finding that progress since 2000 has certainly taken place; however, where progress has occurred in one domain, it may have masked declines in another, and it has been unequal, across and within countries. For example, where net enrollment rates improved dramatically, up 20 percentage points from 1999 to 2012 in 17 countries, reducing dropout has remained difficult, as 58 million children were out-of-school in 2012. Retention persists as a challenge as well: in 32 countries, most of which are Sub-Saharan African countries, 20% of children are not expected to reach the last grade of school. Access across countries continues to be inequitable: the GMR’s analysis revealed that in 2008, 14% of children had never attended school in low income countries, as compared with 8% in low-middle income countries. Thus, although participation rates may have increased markedly, it is clear that improving progression through schooling, retention, and learning outcomes remains a challenge, and that these gains in participation are marred by inequities.
Further breaking down enrollment rates, it becomes clear that progress has been made in reducing gender inequities; however, even though the parity gap was halved where it had been the largest, in Sub-Saharan African and Arab states, it is still below the target, for example with 92/93 girls enrolled for every 100 boys in these regions. The gender disparity is even larger in secondary school. In Arab States, 95 girls (up from 87) were enrolled for every 100 boys by 2012, while in Sub-Saharan African states, only 84 girls (up from 82) were enrolled for every 100 boys. It is also important to note that gender inequities are by no means the only inequities present, but that these were the primary inequities monitored from 2000-2015. Thus, the post-2015 education agenda intends to draw attention to inequities across various subgroups, including wealth, location, ethnicity, language, and disability.
Several EPDC publications illuminate the GMR’s findings (see, for example: Teenage, Married, and Out of School for an analysis of drop-out rates among females; The Nickels and Dimes of Education for All for an analysis on financing EFA; and EPDC’s Inequality Profiles). Specifically, EPDC’s publication on school access, retention, and learning in 20 countries makes it clear that different countries struggle with different aspects of educational progress. The report displays visual representations of how many children enroll in school, whether they remain enrolled until they reach grade 4 or 5, and what percentage of them learn how to read. See Figure 1 for an example.
Figure 1. Learning pyramid example, Mozambique

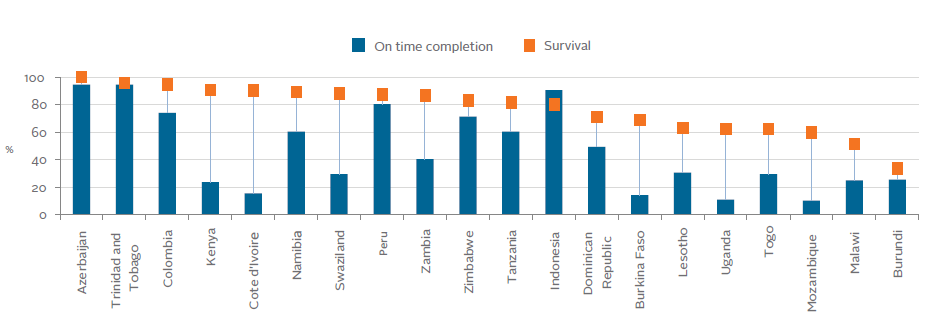
Figure 2. Survival versus on-time completion
Considering learning outcomes across countries, it is only possible to compare within groups which implement the same assessment (the PASEC is the exception; results are not comparable across countries that used this assessment). However, the visuals still demonstrate that many of the countries struggle to provide students with basic literacy skills at grade 4, even where they do not struggle with access or survival. Indonesia is a particularly illustrative example of this phenomenon (see Figure 3). In other countries, such as Burundi, access is near-universal but survival and literacy skills continue to lag (see Figure 3).
Figure 3. Learning pyramids, Indonesia and Burundi
The EPDC report thus demonstrates the overall need to look at the “whole picture” of education indicators rather than any one indicator—access, survival, or learning, for example—in isolation. The 2030 agenda has thus far echoed this need by proposing a spectrum of indicators related to learning outcomes, completion, participation, and provision of education. Where possible, indicators will be disaggregated by male/female, rural/urban and top/bottom wealth quintile. Certainly, however, challenges arise out of this need for a comprehensive analysis and higher level of disaggregation, specifically, the difficulties of counting the most marginalized populations and balancing these numerous indicators and the targets that will follow. Still, it is critical for meeting the WEF’s mission to ensure “equitable and inclusive quality education and lifelong learning for all by 2030."

Add new comment