You are here
January 2016 Household Survey Data Updates
Charles Gale, Research Associate
We’re excited to announce the release of the most recent household survey data published by DHS and MICS. EPDC’s database includes over 870,000 data points extracted from large-scale household surveys, covering over 111 countries. Recent data for 2014 include Zambia, the Gambia, Egypt, and Cambodia (DHS), and Vietnam and Malawi (MICS). We also have recently released data for Bangladesh (2013, MICS). You can browse our database by navigating to each country landing page, or use the Advanced Search on the homepage to further specify which dimensions you would like to look at. We also have a YouTube channel set up to help guide you through different types of data searches, and you can use our ‘Popular Data Searches’ on the homepage beneath the social media buttons to help you in your search.
Data from household surveys represent an important way to supplement official statistics published by government agencies, the difference being that the former are captured at the household level while the latter are typically gathered via an annual school census. As documented in this 2013 EPDC publication, there are sometimes large discrepancies between figures reported from school censuses and those from household surveys, which may be consequential to our understanding of important educational issues within a particular country.
In addition to the database, EPDC provides tools for visualizing key education indicators gathered from household survey and other sources. Our mapping tool allows users to display subnational (and national-level) education data for within or cross-country comparisons. As shown below (figure 1), the attendance rate for girls at the lower secondary level varies greatly across regions in the Gambia, from a low in Basse (8.8%) to a high in Banjul (53.1%). Similarly in Bangladesh (figure 2), a country that has been praised for strides in key development indicators including girls’ education, data plotted using our mapping feature shows a difference of almost 20 percentage points in female adult literacy across the regions. A simple country average obscures these facts, and the map makes a powerful point about the importance of understanding the degree of within-country disparities.
Figure 1 – Lower secondary net attendance rate, girls, Gambia
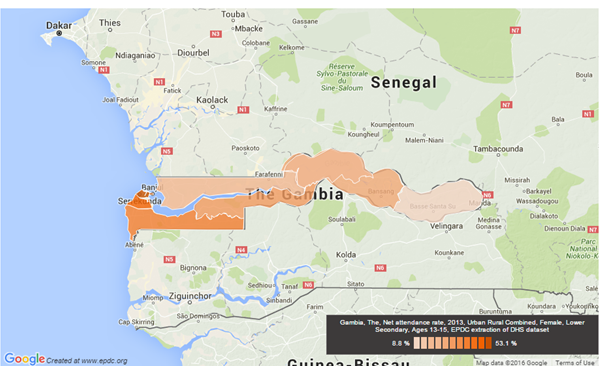
Figure 2 – Adult literacy rate, females, Bangladesh
.png)
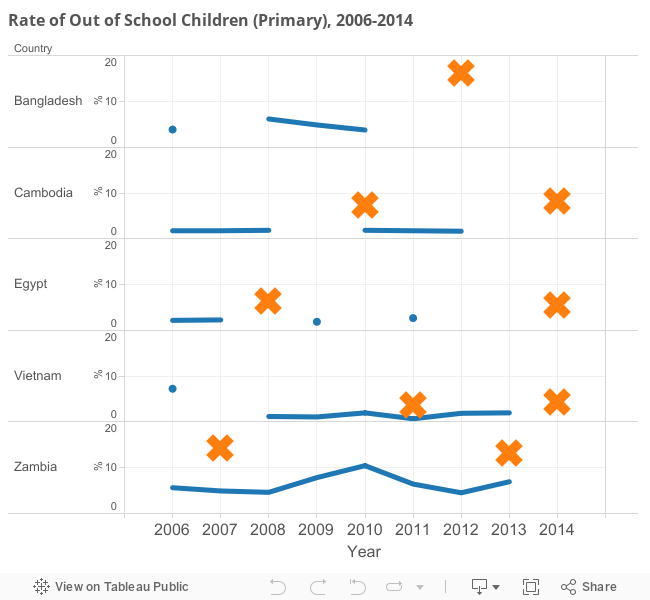
In addition to the EPDC visualization tools, users can export datasets into Excel for analysis in other programs such as Tableau. The figure below plots estimates of out of school children rates for primary school, by country. It shows changes over time, with year to year trends coming from government administrative data and the orange X’s representing estimates from household surveys including the most recent ones. As can be seen, in some countries there is relative overlap between the estimates (i.e. Vietnam and Egypt) while in others (particularly Zambia and Bangladesh) there are considerable gaps. A better understanding of schooling exclusion in a given country emerges when one considers multiple data sources in conducting policy analysis.
Browse these data and for other countries using our database, and utilize the many resources we offer to meet your research and data analysis needs.
Add new comment