You are here
Recent data show improvements in early childhood education in low income countries
By Nguyen Thi Thanh Huyen (PhD Candidate, Kobe University and Intern, EPDC), and Charles Gale (Research Associate, EPDC)
While it’s common for researchers and data analysts to begin their search for education data at well-known, internationally comparable databases such as the UNESCO Institute for Statistics (UIS), the World Bank, and the OECD, EPDC complements these with data pulled directly from ministries of education and national statistics offices. Although there are some differences between data collected directly from administrative sources and those published through international sources, a key advantage with going straight to the source is that it provides data published according to nationally defined education levels, as well as subnational or other types of disaggregations not offered in the international databases.
We have recently updated the EPDC database with administrative data pulled from national statistical bodies. Some of the indicators we regularly collect are related to internal efficiency in education such as rates of completion, promotion, repetition and dropout; education access such as gross enrolment rates (GER), gross intake rates (GIR), net enrolment rates (NER) and net intake rates (NIR). We also publish data on raw numbers of pupils, teachers, schools and classrooms. Lastly, we also include data on a country’s nationally defined education systems, including cycle durations for all levels of education, as well as official entry ages.
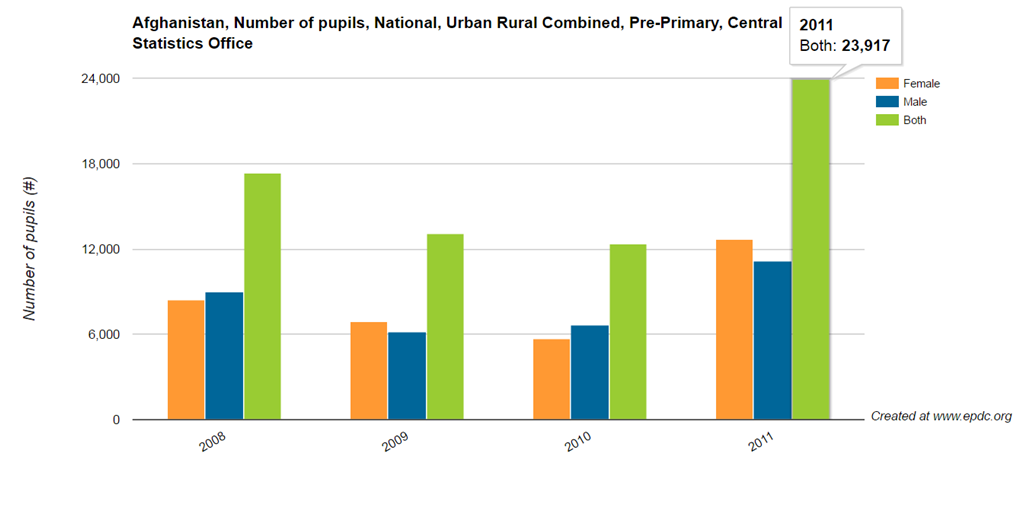
To begin our data collection from administrative sources, we identify countries which historically have not produced much education data. Of the 31 countries we identify, the majority are in Sub Saharan Africa, and 61.3% have had recent data updates (since 2011). One interesting trend we observe is the increased monitoring of early childhood education across countries. For example prior to 2008, it was hard to find statistics on pre-primary education in Afghanistan, which may mean this cycle of education has been monitored more closely in recent years. As can be seen in Figure 1, the number of children enrolled in pre-primary school increased by almost 50% between 2008 and 2011, despite decreasing birth rates throughout in the decade up to 2014[1]. This surge has also coincided with an increase in the number of teachers and schools. It is noted however, that many Afghan children go to mosque schools, which may not be included in official administrative figures. Other countries with recent data on pre-primary education include Bulgaria, Rwanda, Democratic Republic of the Congo, Bhutan and Nepal.
Figure 1: Pre-primary enrollments in Afghanistan, 2008-2011
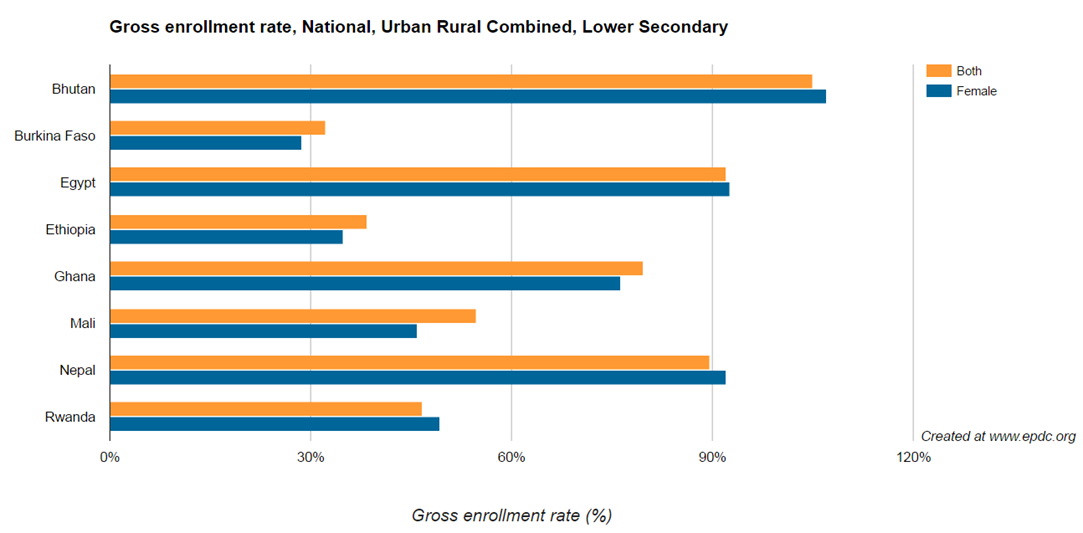
Other interesting trends are noted across countries. Recently released data show that Sub Saharan African countries continue to lag behind other regions in terms of access to secondary education. Figure 1 below shows a gap in gross enrollment rates (GER) between Sub Saharan African countries such as Rwanda, Mali, Ethiopia and Burkina Faso, and South Asian countries such as Nepal and Bhutan. Another contrast that can be seen is the gender disparity in access to secondary school in these two regions. For example, gender parity can be measured as a ratio of girls’ enrollment to boys’ enrollment, which means a negative number indicates disparity in favor of males. Gender parity tends to be negative for girls in Sub-Saharan Africa, while it is positive for girls in South Asia. Among the Sub Saharan African countries shown, only Rwanda shows a positive gender parity ratio for girls.
Figure 2: Gross enrollment rates for lower secondary school, select countries (2011-2015)
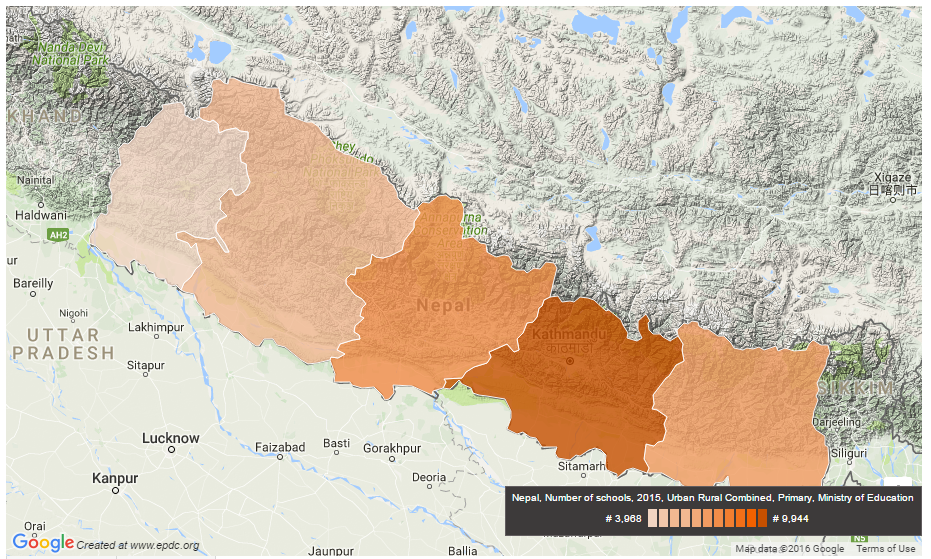
Taking a look at number of schools for different cycles of education in different regions in Nepal, it is strikingly observed that the number of primary schools are roughly proportional throughout all regions of the country. Figure 3 illustrates the number of primary schools of all regions in Nepal, which shows the biggest density is in the central region and the least in in the far-western. This trend is not only true to primary level but to all levels of education in Nepal. Compared to the number of primary schools, the number of lower and upper secondary schools together may make up less than 50% of the total schools. Similar disparities in Nepal were highlighted in a previous post.
Figure 3: Concentration of primary schools in Nepal by region, 2015
A challenge with collecting and disseminating education data is in determining how (and whether) to make education data comparable across countries. UIS has developed the International Standard Classification of Education (ISCED) for this purpose, although as our intents are simply to disseminate the data as it has been published, we do not run in to as many challenges. However, there are important differences in how some countries distinguish secondary education, which provide challenges. For example, South Asian countries such as Bhutan and Nepal have segregated their secondary education systems into three different levels: lower secondary, secondary/middle secondary and higher secondary, which is distinguished from the more common practice of separating secondary into a lower and upper tract. Similar to other international databases, EPDC combines the two “higher” secondary levels into a single upper secondary level, and keeps lower secondary the same. You can see our collection notes page for more information on our data collection process.
Related links:
EPDC Administrative Data Collection page
UNESCO Institute for Statistics
[1] Data from the World Bank Databank.
Add new comment