You are here
Filling in the Blanks: Estimating the Total Number of Out of School Children in Sub-Saharan Africa
Filling in the Blanks: Estimating the Total Number of Out of School Children
Carina Omoeva, Director, Education Policy and Data Center
Charles Gale, Research Associate, Education Policy and Data Center
Hugo Van Dyke, Intern, Education Policy and Data Center
The problem of missing data is ubiquitous in international development, and even more so, in international education. While international data collection systems, and data reporting by countries, have improved substantially over the past two decades, incomplete datasets are still more of a norm than an exception for many education indicators. As an example, data on out of school rates are missing at about a 40% rate in any single year between 2000-2010. These gaps in data make it difficult to estimate the total level of school exclusion, such as the total number of out of school children (OOSC) at the regional or global level. Furthermore, as the analysis here will show, different methods of dealing with missing data yield slightly different outcomes, thereby creating a “plausible range” where the true value is most likely to fall.
For this exercise, we attempt to complete the dataset of country-level out of school rates published by the UNESCO Institute for Statistics (UIS). In the absence of a published methodology for missing data imputation from UIS, we are unable to replicate the aggregate regional and global estimates for these statistics by the agency. However, we employ a variety of methods that are reportedly used by UIS and other international agencies, and compare the results. Finally, we turn to survey data as an additional source of information, and offer comparisons with estimates obtained using administrative data. In each case, we apply different missing data imputation techniques to calculate estimates for the number of OOSC in one region of the world: Sub-Saharan Africa (SSA), where over half the countries do not publish or report rates for 2011. The starting point for this range of estimates is the published regional value at 29,797,816 out of school children.
Group mean imputation
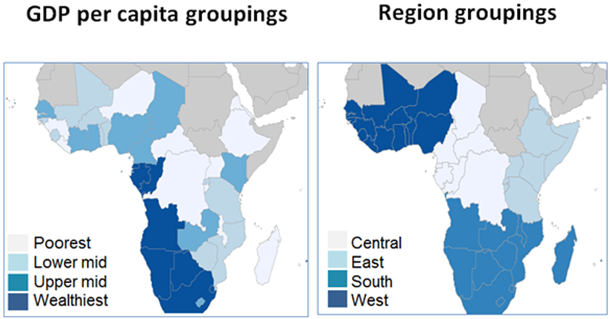
Of the 24 countries in Sub-Saharan Africa with an unpublished rate in 2011 (as of February 2014), 23 of these countries have other observed data points for indicators that can be useful in determining an appropriate imputation technique. A simple mean imputation across all Sub-Saharan African countries would be inappropriate, given that the observed OOSC rates ranged in value from 2.3% (Mauritius) to 67.1% (Eritrea). To account for this wide range, we use two different approaches for creating groups: 1) an economic grouping, based on the countries’ most recent GDP per capita (poorest, lower middle, upper middle and wealthiest), and 2) a geographic grouping, dividing SSA into subregions (East, West, Southern, and Central. Once the groups were established, the mean value of OOSC rate within each group was used to replace missing values.
Recall that our starting point, the UIS published estimate of 29.8 million out of school children in SSA in 2011 is current as of February 2014. Using group mean imputation, we obtained two alternative estimates for the region: 30.9 million using geographic grouping, and 33.5 million using wealth (as measured by GDP per capita).
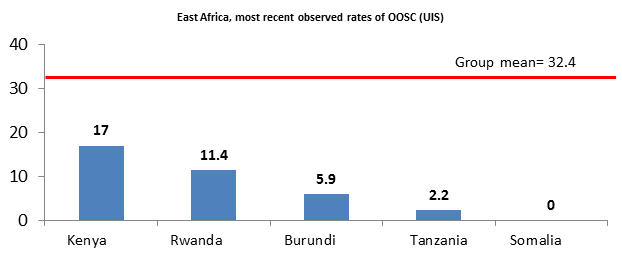
While both of the grouping choices are arbitrary, and differences in group mean values can be expected to differ, a cursory examination of the results of geographic group mean imputation in Sub-Saharan Africa reveals potential problems. As the number of observed OOSC rates differed significantly across the sub-regions on the continent, so did the reliability of the mean estimate. Only three countries had published rates in East Africa, making it difficult to obtain a reliable estimate for the mean of the subregion. Comparing this regional mean rate of 32.4% to the most recent observed rate of each country in East Africa provides evidence of how poorly this mean value fit the observed pattern of school exclusion in these countries (see figure).
Further, in subregions with greater data availability, such as West Africa, the range of observed values called into question the appropriateness of the mean rate as a replacement for a missing value (the rates ranged from 4.3% in Cape Verde to 59% in Liberia).
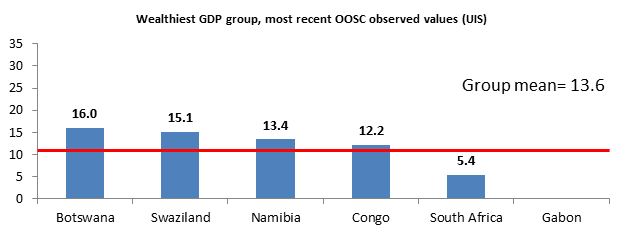
The wealth-based grouping yilelded somewhat better results. The mean estimate for the wealthiest group (seen below), was within close range of observedf OOSC rates among these countries. However, while the wealthiest countries had similar OOSC rates (displayed above), there were large differences in the statistics of countries with the lowest GDP per capita: Uganda had an OOSC rate of 8.9% and Eritrea above 65%. Which group mean imputation method is better – meaning, getting us closer to the true value? It is difficult to judge based on available information, but it appears that the wealth-based estimate resulted in closer distributions of observed values, and hence, less chance of an imputed value being far off the plausible range.
Last observation carried forward
In time series datasets, missing values are often replaced with the most recent available values, in a method called “last observation carried forward”, or LOCF. As we have demonstrated above, observed values for a given historical period may provide a good gauge of the level and scope of the issue at hand, in some cases better than group mean imputation. As we apply the LOCF method we must still, however, rely on an alternative method for those countries where the time series contain no data on out of school children, or where the last observed value is too far back from the time point in question. Here, using LOCF imputation and completing the remaining gaps with wealth-based and geo-based group mean imputation, we estimated the total number of OOSC to be around 34.9 million
The LOCF method also carries some risks. As OOSC rates fluctuate over time, considering only the last observed rate will ignore trends that can be of utmost importance in making predictions to impute missing data. For example, there are no published values for Somalia, Gabon and Sierra Leone , while the Democratic Republic of the Congo’s last reported rate was from 1999. Using a value from over 10 years ago or omitting three countries from the estimate of the total number of out of school children will clearly alter the accuracy of the estimate.
Calculating slopes
In situations where at least several data points are available for 2000-2012, one may seek to fit a time trend that can then be extrapolated to the period in question (in our example, 2011). Without an obvious pattern or the previous year’s observed value, more complicated models need to be considered. The UIS Global Age-Specific Literacy Projections Model and the ILO Global Employment Trends (GET) Model are examples of such models researched in the EPDC’s lit review. Using a similar methodology as the ILO and UIS, the EPDC only considered recent data for our estimates. Certain countries with observed rates experienced too large a change in OOSC rates in last 15 years, so a cut off of 2006 was established. For example, the United Republic of Tanzania had an OOSC rate of 50.7% in 1999 and 2.7% in 2008.
If a trend was determined, the missing data point was predicted based on previously observed rates. If a trend was not established but the country published a rate since 2006, then LOCF was implemented. For countries without recent data, the EPDC relied on group mean imputation. The estimates for the total OOSC in SSA are in the following graphic:
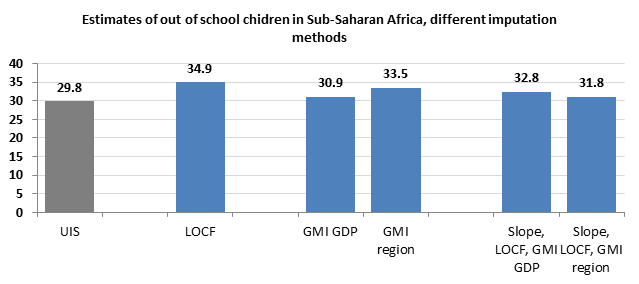
As can be seen, the UIS estimate, which is believed to be based upon some kind of combination of these methods (see their education indicator methodology), is slightly below any of those that we have calculated. Most important however, is to recognize the estimate of out of school children as a range of numbers, rather than a single and precise estimate. A more thorough discussion would include a rationale for using the different types of imputation discussed above. These ideas will be expanded upon in a future post, where we present other estimates based on regression and multiple imputation.
Add new comment