You are here
EPDC Spotlight on Nepal
Sarah Gates, Research Intern, EPDC
This post continues our Country Spotlight series, where we highlight a different country and the resources we offer, such as data, country profiles, research or other tools that users have available to them through the website. In this post, we highlight the data resources we have for Nepal.
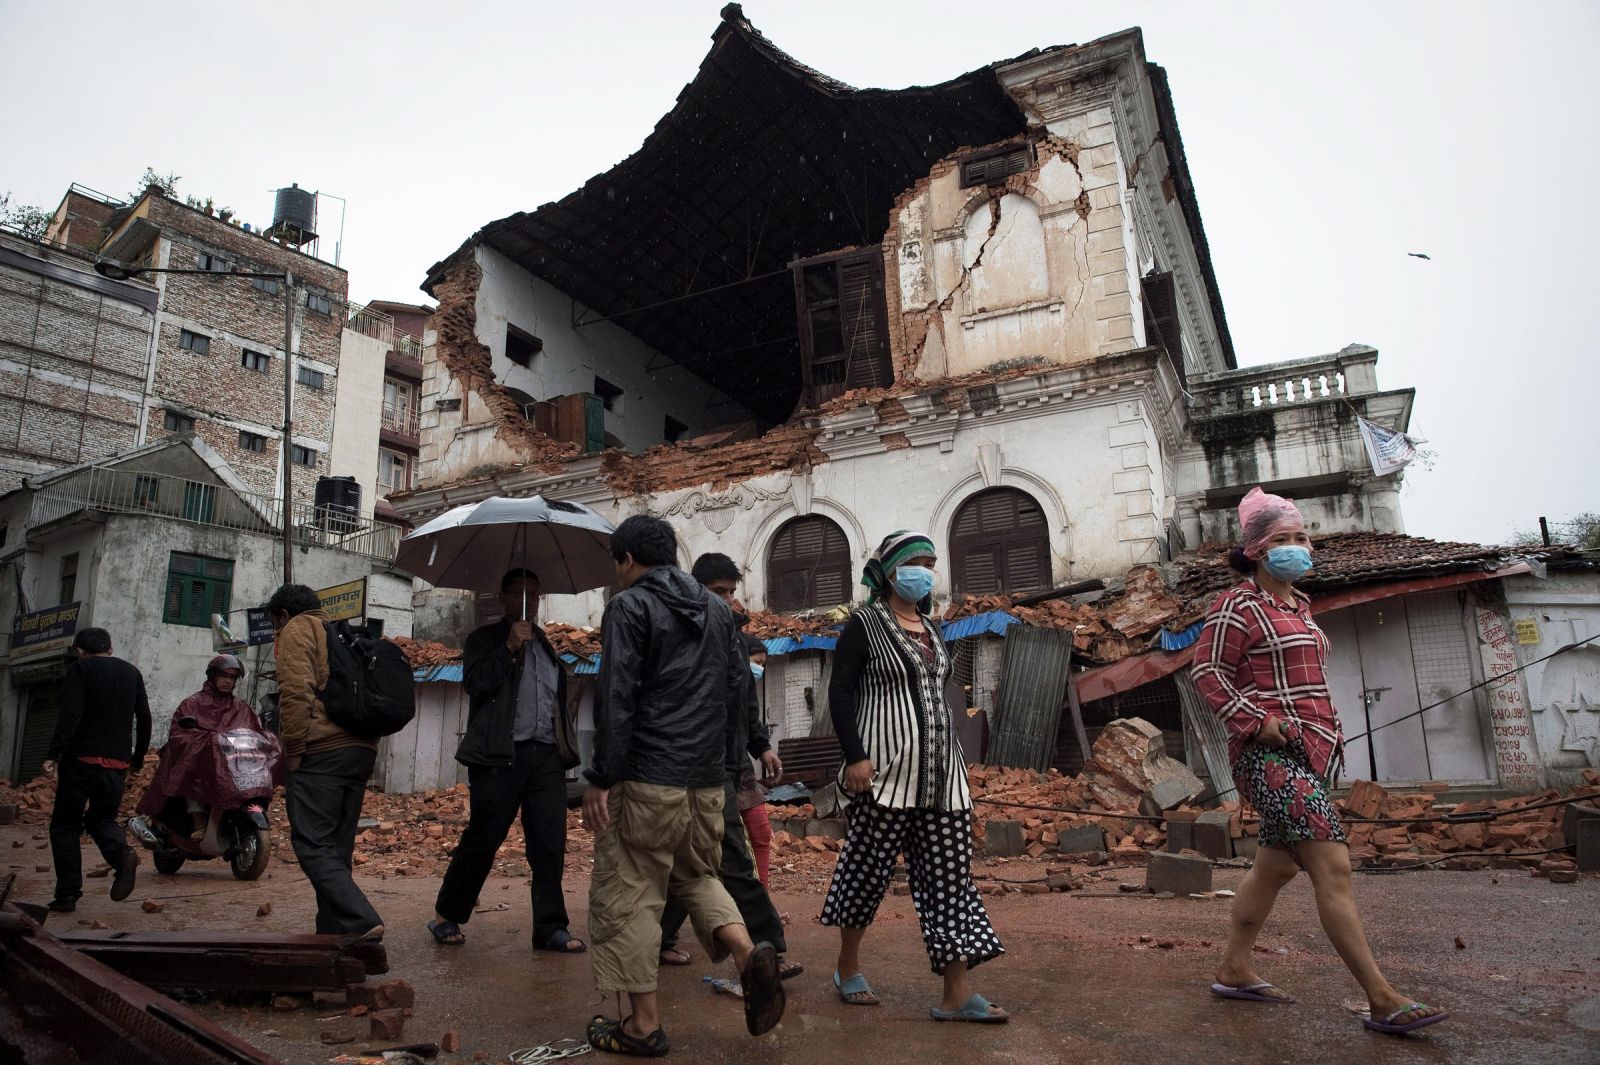
In the immediate aftermath of the April 25th earthquake in Nepal, figures indicate that millions have been displaced, an estimated 3 million people are in need of food and shelter, 6,204 people are known to have died, and 13,932 people have been injured. In addition, an estimated 16,000 schools have been damaged, and all schools will be closed for at least two weeks as the government responds to the immediate damage. The schools that were not damaged are being used as shelters by populations displaced by the earthquake. Concern is also escalating around the unknowns, such as affected areas which have not been reached by rescue teams and the possibility of disease outbreak in overcrowded areas.
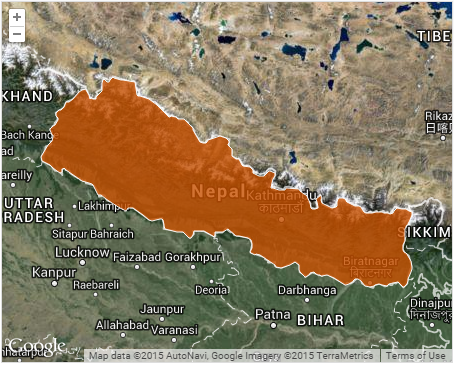
Figure 1. Map of Nepal, 2015
Certainly, the long-term consequences to education are also unknown. The earthquake will continue to affect schools, students, and teachers for years to come as well as in the earthquake’s immediate aftermath. In the most-affected Western and Central regions, as of 2011, there were 2,566,668 primary school students and 1,476,149 secondary school students (for a total of 4,042,817 students), as well as 16,844 primary schools and 6,429 schools that were providing lower secondary education (grades 6-8) (see Figure 2). Save the Children staff estimate that in Gorkha district alone, in Nepal’s Western region and the location of the earthquake’s epicenter, 90% of the 500 schools were destroyed or badly damaged, affecting 75,000 schoolchildren.
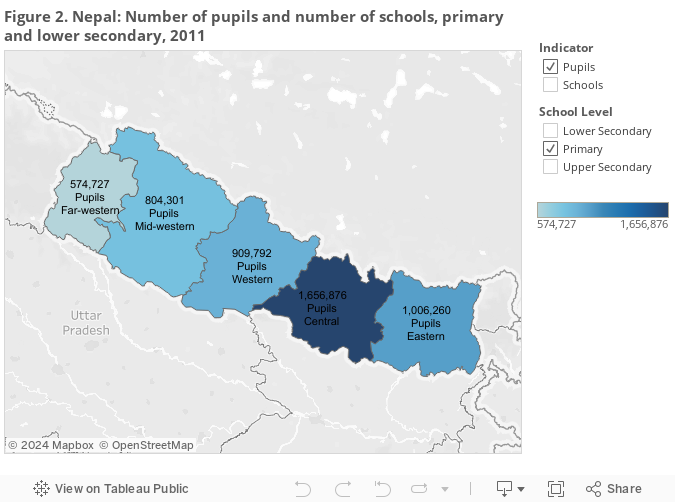
Data Source: Ministry of Education, Nepal
This blog post examines Nepal’s education system over the past ten years and evaluates future challenges in light of the country’s educational context.
Country Context and School System
Nepal is a landlocked country in South Asia, with an estimated population of 30 million. It is bordered to the north by China and to the south, east, and west by India. One of the world’s poorest countries, Nepal ranks 157th out of 187 countries on the Human Development Index; however, the proportion of poor people in Nepal was halved in only seven years. Nepal continues its political transition out of the decade-long civil conflict between the Government and the Communist Party of Nepal (Maoist), which ended in 2006.
In Nepal, the academic year begins in May and ends in April, and the official primary school entrance age is 5. The system has a 5-3-4 structure; in other words, the primary school cycle lasts 5 years, lower secondary lasts 3 years, and upper secondary lasts 4 years. Nepal has a total of 7,665,000 pupils enrolled in primary and secondary education. Of these pupils, about 4,577,000 (60%) are enrolled in primary education.
Nepal is transitioning to an 8-4 structure, in which basic education is comprised of grades 1-8 and secondary education is comprised of grades 9-12. National administrative sources often provide data according to both the current (5-7) structure and the proposed (8-4) structure. Administrative data in the website has been collected according to the current 5-7 education structure. UIS has consistently classified the school structure in Nepal as having a 5-3-4 structure. See Nepal's National Education Profile and Nepal's country landing page for additional background information.
Considering education in Nepal, several trends are worth noting. As of 2011, approximately 12% of youth had no formal education and 10% of youth had, at most, incomplete primary education; this indicates that, in total, 22% of Nepalese 15-24 year olds had not completed primary education in 2011. Increasing access to secondary education (grades 9-12) also remains a major challenge. In 2014, the gross enrollment rate for primary school was 132.7%, compared with a gross enrollment rate of 67.0% for secondary school (see Figure 3). It is also notable that the highest repetition rate is in primary school in grade 1 at 17.52% (for both males and females), as of 2013, 8.02 points higher than the average repetition rate across primary grades of 9.4%. Interestingly, females have higher gross enrollment rates, gross intake rates, and completion rates, beginning around 2008 up until 2014 (see Figures 3-5).
Looking at Figure 3, which displays gross enrollment rates for males and females for both primary and secondary school, it is clear that, although females’ gross enrollment rates (GERs) are lower than males’ GERs until 2006, they are actually higher from 2008 to 2014. This is a stark change from 2004, when male GERs were 16 percentage points higher than female GERs. It is also interesting that the GER for both males and females began to decline in 2011. This might indicate that previously, as many students' ages had exceeded the official entrance age (5), beginning in 2011, students ages' more closely corresponded to the offical enrollment age. GER for both males and females was 132.7% in 2014, compared with a net enrollment rate in 2013 of 98.48%. These two figures suggest that the country has achieved near-universal primary education. Secondary enrollment rates, however, are much lower than primary enrollment rates, with a GER of 67% for both males and female in 2014 and a net enrollment rate of 60.23%. A similar gender pattern unfolds, as female enrollment rates surpassed male enrollment rates in 2012.
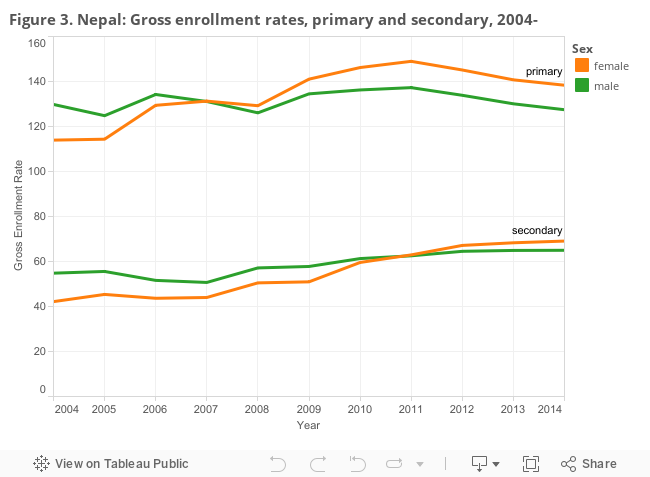
Data Source: UNESCO
Gross intake rates, which indicate the general level of access to the first grade of primary school, reveal similar patterns, as females exhibit higher GIRs than males beginning in 2008. Notably, GIRs decline sharply beginning in 2006 until about 2008, and similar to GERs, decline again in 2011, remaining fairly stable from 2012-2014 (see Figure 4).
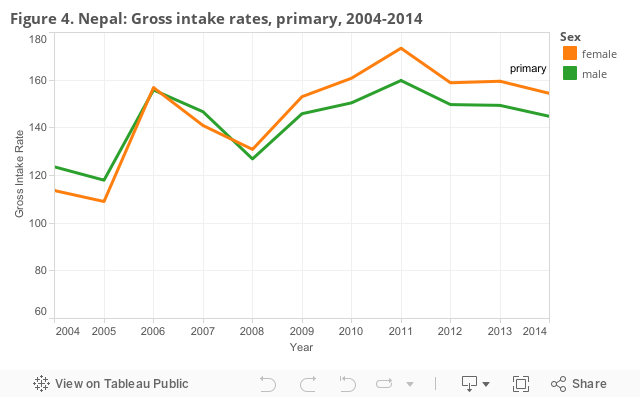
Data Source: UNESCO
Looking at Figure 5, it is clear that, over the past ten years, Nepal has seen fairly steady progress in primary and secondary completion rates, especially for females. In 2004, female completion rates for primary schooling were only at 70.3%, whereas by 2014 they had reached 107%. Male completion rates decreased slightly from 2006 to 2008 and began to pick up again, reaching 96.52% in 2014, about ten percentage points lower than female completion rates.
Lower secondary school completion rates, like secondary gross enrollment rates, however, are overall low, although they progress fairly steadily from 2008 to 2014. Lower secondary completion rates for females, again, are higher than males’ completion rates, by about seven percentage points, in 2014.
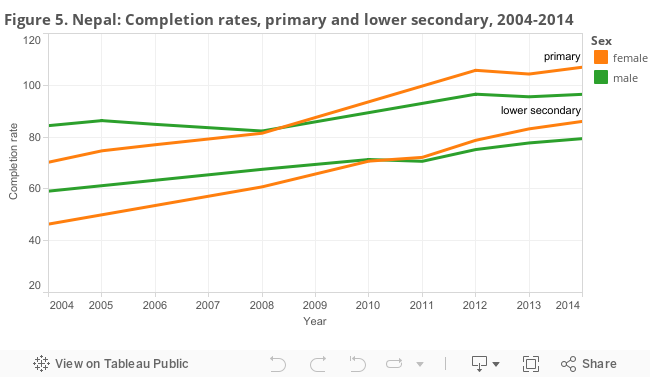
Data Source: UNESCO
Figure 6 illustrates inequalities in educational attainment by both gender and region in 2011. It is notable that the Western region, one of the regions most heavily affected by the earthquake, is also the region with the highest mean years of schooling for females in 2011, at 7.2. The Central region, the other region most heavily affected, has among the lowest mean years of schooling for females, at 5.9, and the lowest mean years of schooling for males, at 7.5.
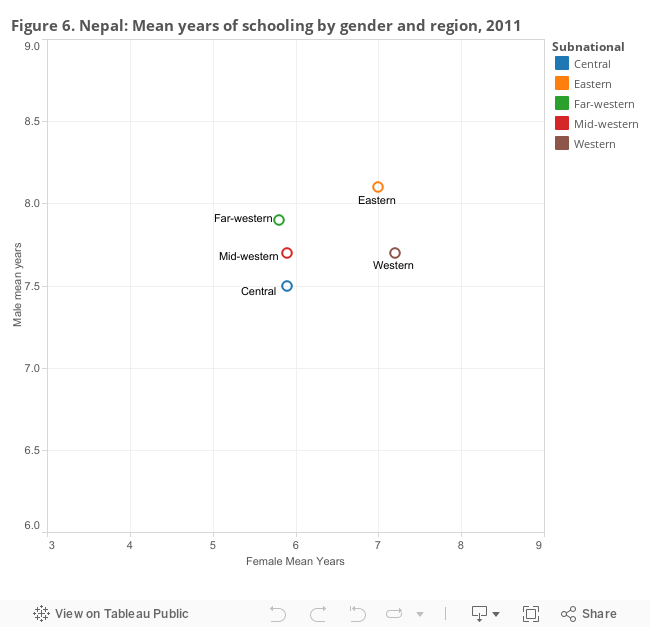
Data Source: EPDC extraction of DHS dataset
From the above discussion of Nepal’s education data, it is clear that the country has demonstrated significant progress over the last ten years, especially for females, in terms of access to, participation in, and completion of schooling. However, given the destruction of schools, deaths of students and teachers, and displacement of millions, challenges such as secondary school access, gender and regional inequalities, and high repetition rates in grade 1 will only be multiplied.
Add new comment